A quiet zero-knowledge compute token just ripped 87% in a day, and it wasn't random noise. A symmetrical triangle finally snapped. Does the move hold, or does it fade before the weekend? Why
A quiet zero-knowledge compute token just ripped 87% in a day, and it wasn't random noise. A symmetrical triangle finally snapped. Does the move hold, or does it fade before the weekend?
Why This ZK Compute Token Suddenly Woke Up
Cysic price prediction searches are spiking this week, and there's a reason. A token stuck in a months-long grind just posted its sharpest weekly candle yet.
It isn't hype alone. There's a real chart pattern behind it, plus a live product launch and volume that backs both up.
Here's the thing: after moves this sharp, the next few sessions usually decide everything. Either buyers defend the breakout, or early sellers turn it into a trap. What happens next?
Table of Contents
Why CYS Is Moving Today
Daily Chart
Weekly Chart
Support And Resistance
Scenarios By Timeframe
Tokenomics
Liquidations
Altcoin Narrative
Risks
Glossary
Key Takeaways
CYS trades near $0.5450, up 87.24% in 24 hours per CoinMarketCap, 28.05% below its March all-time high.
Daily RSI reads 79.41, overbought; weekly RSI sits at 60.52, neutral.
Weekly chart broke a symmetrical triangle; daily chart cleared a descending channel.
Circulating supply is 160.8M of 1B max CYS, FDV near $545.04M.
Invalidation for this Cysic price prediction sits under $0.2761.
Why CYS Is Moving Today
The catalyst isn't mysterious. Cysic's team launched InferBench this week, a benchmark platform measuring real AI inference performance across engines like vLLM, SGLang, llama.cpp, and Ollama. That's a direct pitch to the decentralized compute crowd.
Volume followed. Per CoinMarketCap, 24-hour volume jumped over 3,032% to $105.66M, pushing volume-to-market-cap to 115.12%. Not a thin, easily reversed move.
It also lines up with a weekly pattern building for months. Worth checking thecoin events calendar before assuming a breakout stands alone.
CYS Technical Analysis: Daily Chart
$CYS opened near $0.5660 and printed a high of $0.5886 before slipping to $0.5475, down 2.91% on the MEXC daily chart via TradingView. That's a cooldown candle on top of yesterday's descending-channel breakout, not a fresh breakdown.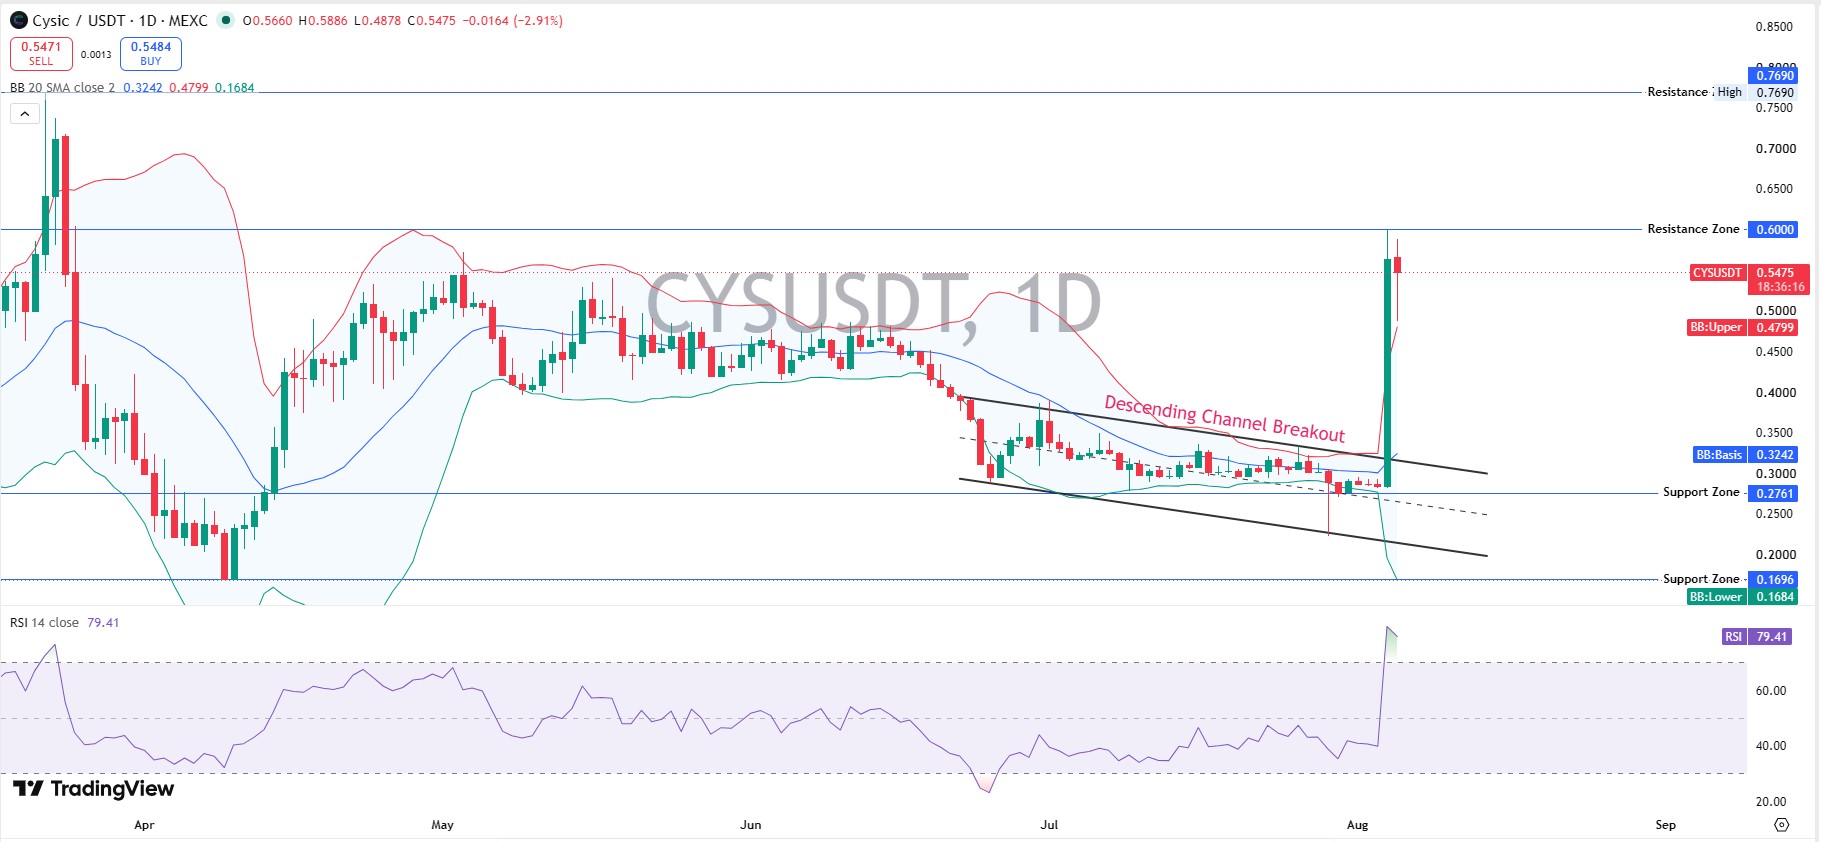
Resistance stacks at $0.6000 first, then $0.7690 near the March high. Support holds at $0.2761, backed by a deeper floor at $0.1696. Daily RSI reads 79.41, badly overbought. Strong momentum, but a read this stretched usually cools first. A close above $0.6000 confirms continuation; losing $0.2761 fast flips this Cysic price prediction bearish.
CYS Technical Analysis: Weekly Chart
Zoom out and the picture changes. $CYS spent most of 2026 grinding inside a symmetrical triangle before this week's breakout, squeezed between falling highs and rising lows since March. That compression usually resolves hard, in one direction.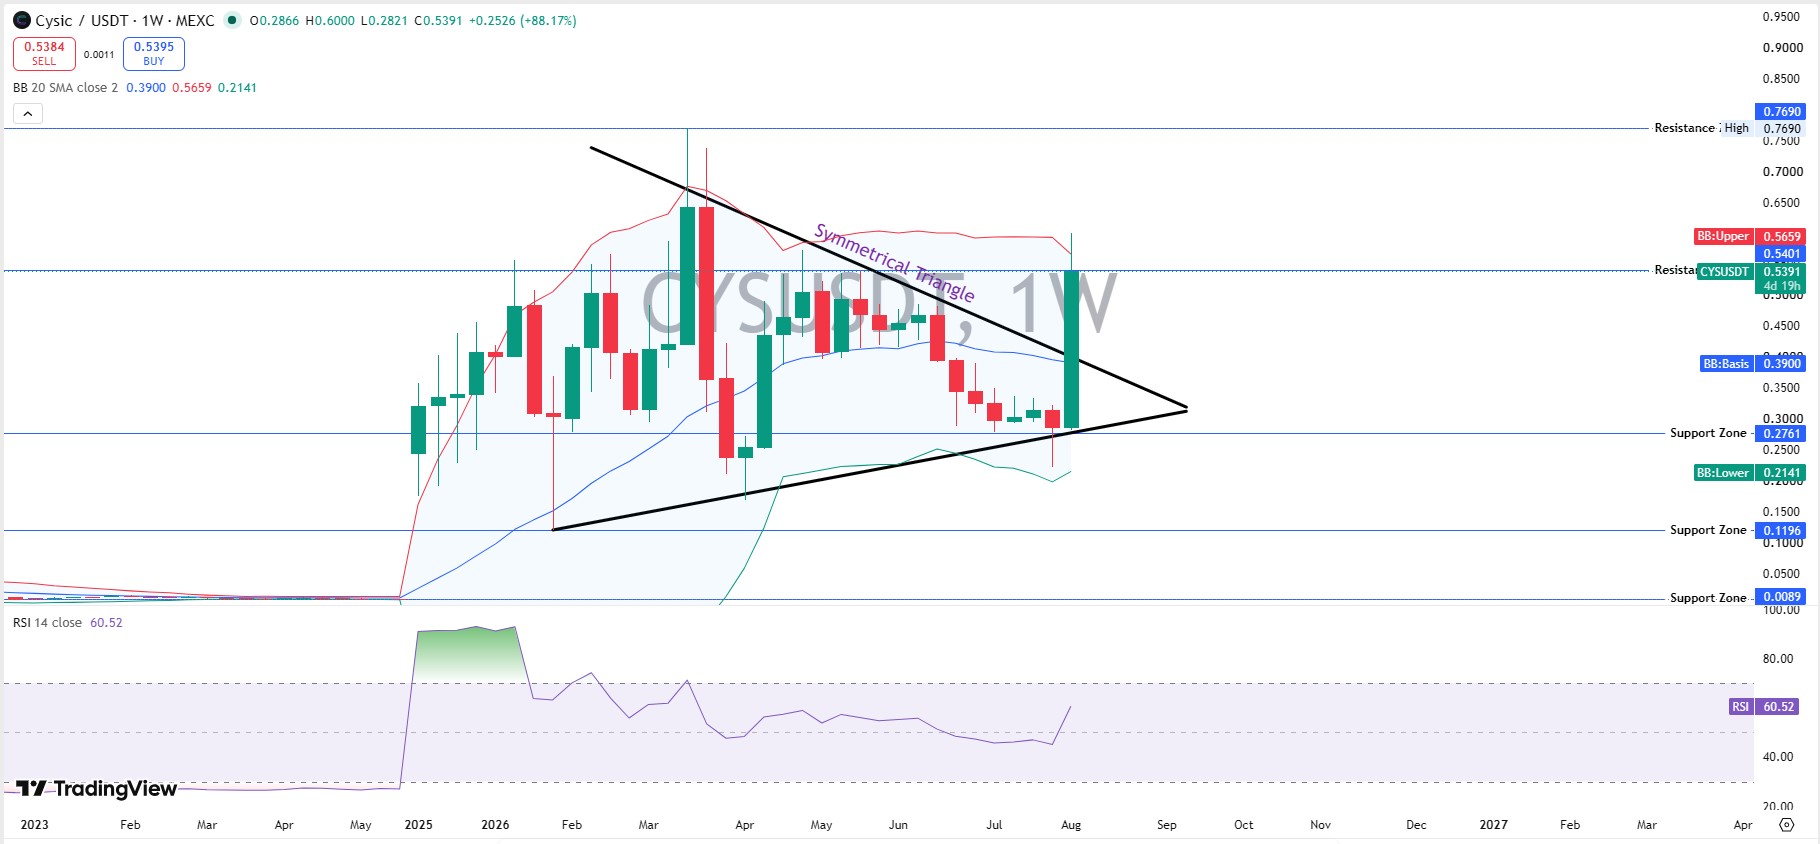
This week's candle broke straight through the triangle on a volume surge, closing near $0.5391, up 88.17%. Weekly resistance runs at $0.7690. Support sits at $0.2761, then $0.1196, then $0.0089 far below.
Weekly RSI reads just 60.52, nowhere near overbought. A breakout on a cooler weekly reading tends to carry more follow-through than a daily spike. Nothing's confirmed until the price closes above $0.7690 weekly.
CYS Support And Resistance Levels
Support: $0.2761, $0.1696, $0.1196, $0.0089.
Resistance: $0.6000, $0.7690.
Cysic Price Prediction 2026: Scenarios By Timeframe
Timeframe
Bull
Base
Bear
24H
Holds $0.55, tests $0.60
Chops $0.48-$0.56
Slips under $0.2761
7D
A weekly close above $0.6000 opens $0.7690
Range-bound near breakout zone
Daily close under $0.2761 fades
2026
Continuation targets $0.77-$1.00
Drifts $0.35-$0.60
Breaks toward $0.1196
Invalidation for the bullish $CYS price target 2026 stays a daily close under $0.2761.
CYS Tokenomics And Network Data
Total and max supply sit at 1B CYS, with circulating supply near 160.8M, per CoinMarketCap. Market cap runs $87.64M against an FDV of $545.04M, so most supply hasn't unlocked yet. Liquidity-to-market-cap is thin at 1.97%.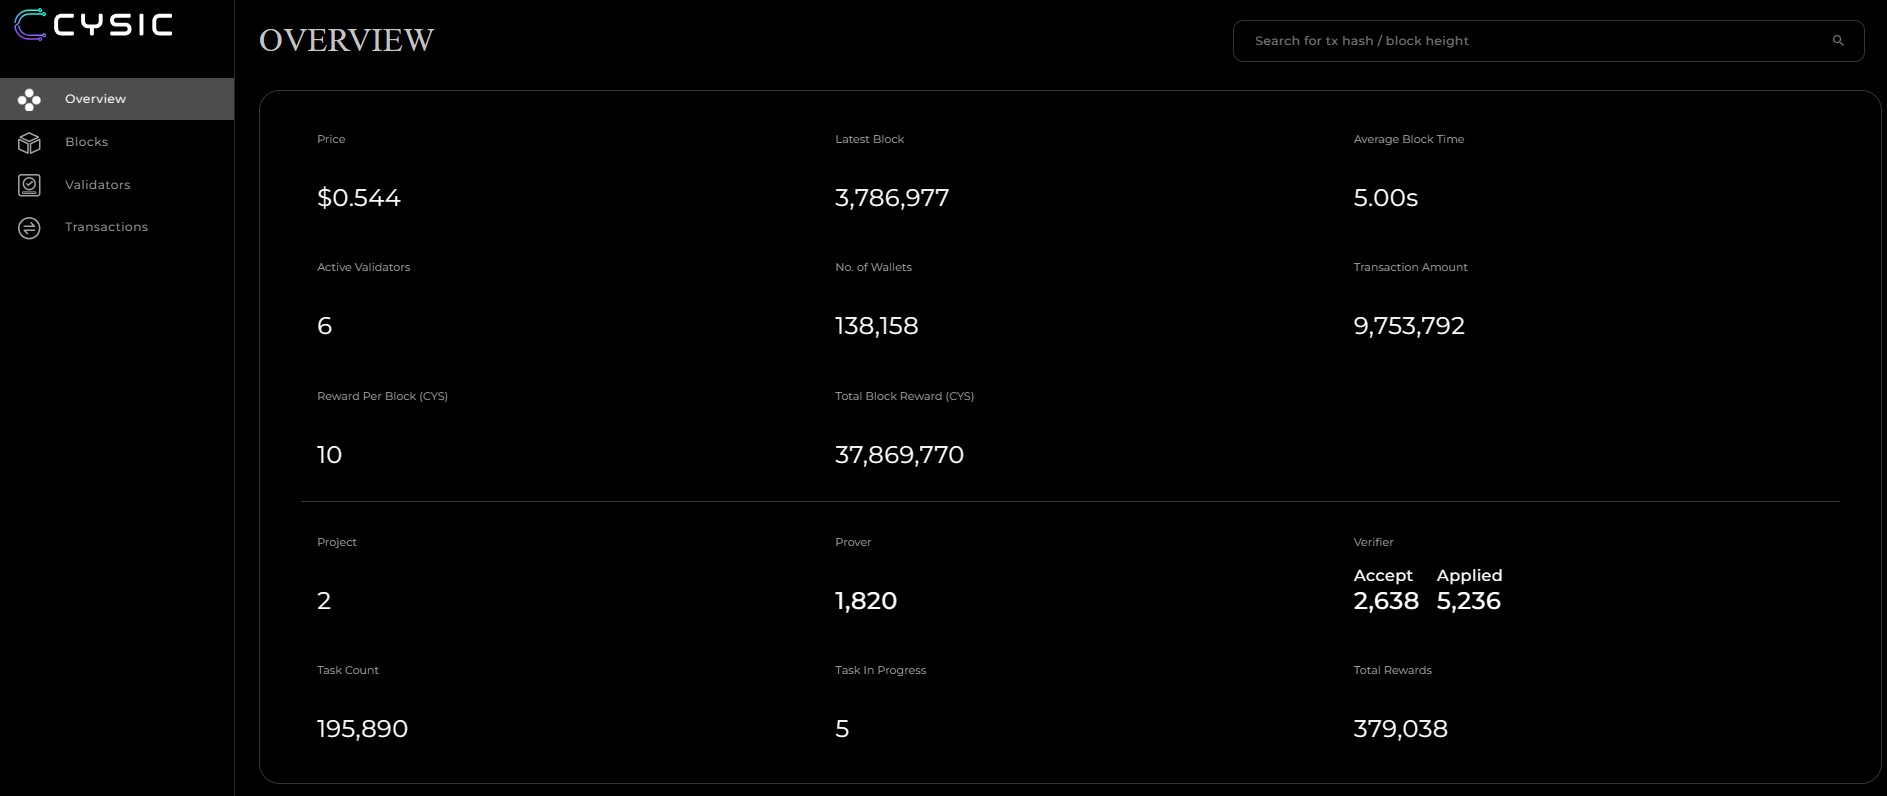
On-chain, the Cysic explorer shows 138,158 wallets and six validators processing blocks every 5.00 seconds. The prover count sits at 1,820, with 195,890 tasks completed and 379,038 CYS paid in rewards. CertiK rates the contract 4.4 out of 5.
Liquidations And Exchange Volume
Per CoinGlass, 24-hour liquidations hit $2.29M, splitting $658.95K longs versus $1.63M shorts. Shorts got hit hardest.
Binance carries the heaviest futures volume at $334.68M, with Bitget near $65.37M and Bybit close behind at $58.88M, worth checking against thebitcoin price prediction trend for context.
CYS And The Altcoin ZK-DePIN Narrative
Cysic isn't a meme chart riding a joke. It's zero-knowledge proving and decentralized GPU compute, the kind of infrastructure altcoin that pulls capital in whenever AI-crypto sentiment turns positive.
InferBench is the clearest proof point. As Cysic's team put it on X, the tool measures what real hardware delivers across multiple inference engines, not just marketing benchmarks. A follow-up meme post even compared it to older tools, a small detail, but it shows an engaged builder base.
This altcoin price prediction trend often tracks broader risk appetite, and search interest keeps climbing alongside theearlier Cysic price prediction piece that covered the setup before this breakout.
Market Outlook: Risks And Catalysts
Unlocking pressure tops the risk list. With just 160.8M of 1B CYS circulating, future unlocks could weigh on price even if demand holds.
A softerFed rate decision tends to lift risk appetite across altcoins, $CYS included. Liquidity stays thin, so check anexchange listing tracker before assuming deep order books everywhere.
A break below $0.2761 puts this Cysic price prediction back on a bearish footing fast.
Glossary
RSI: A momentum indicator, 0-100; above 70 is overbought, below 30 is oversold.
FDV: Market cap if all 1B CYS circulated today.
DePIN:Decentralized physical infrastructure, here Cysic's GPU compute network.
Methodology
Chart levels from CYS/USDT daily and weekly charts on MEXC via TradingView, RSI-14, captured August 5, 2026, 13:00 UTC. Price and supply data from CoinMarketCap, network data from the Cysic explorer, and liquidation data from CoinGlass.
Disclaimer
This is speculative market commentary, not financial advice. Crypto assets are volatile and can lose most or all of their value. Verify live figures before trading.