Ethereum’s market cap fell by $54 billion in three weeks as total open interest across exchanges dropped to $11.5 billion. Binance open interest declined by $1.3 billion to $5.7 billion, whil
- Ethereum’s market cap fell by $54 billion in three weeks as total open interest across exchanges dropped to $11.5 billion.
- Binance open interest declined by $1.3 billion to $5.7 billion, while Gate, HTX and Bybit also recorded substantial monthly decreases.
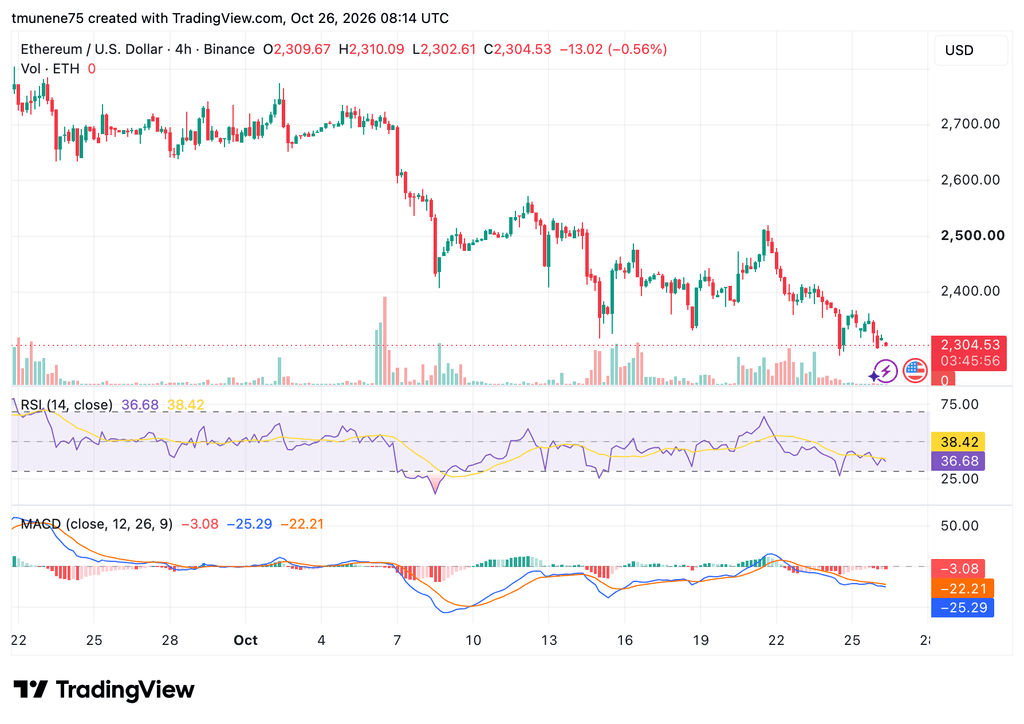
- ETH trades near $2,304 with bearish RSI and MACD readings; a break below $2,300 could expose $2,250 and $2,200 support.
Ethereum has lost $54 billion in market capitalization over three weeks as ETH fell about 15% and derivatives traders reduced exposure. Analyst Darkfost reported that total Ethereum open interest across exchanges dropped to $11.5 billion. Meanwhile, ETH traded near $2,304.53 on October 26, as technical indicators showed continued selling pressure.
Ethereum Open Interest Falls Across Major Exchanges
Darkfost reported that Ethereum open interest on Binance declined by $1.3 billion in one month, reaching $5.7 billion. Across other platforms, Gate recorded a $995 million decrease, HTX lost $857 million, and Bybit fell by $310 million over 30 days.
Despite the declines, Binance still accounted for 50% of Ethereum’s total open interest. Bybit held 17.5%, while Gate and OKX each accounted for 14.7%. Darkfost attributed the broader decline to falling prices, liquidations, and traders closing positions to reduce risk.
The analyst also noted that open interest fell more sharply in July. That deleveraging period preceded Ethereum’s stabilization and a technical rebound exceeding 32%, which pushed ETH above $2,800 for the first time since January.
ETH Chart Shows Bearish Momentum Near $2,300
The four-hour ETH/USD chart on Binance showed ETH trading at $2,304.53 on October 26, down $13.02, or 0.56%, on the latest candle. Ethereum traded around $2,700 in early October before falling below $2,600 and then $2,500.
Temporary rebounds lifted ETH toward $2,550 around October 12 and $2,510 on October 21. However, sellers regained control, pushing the price toward $2,300.
Source:
TradingView
The Relative Strength Index stood at 36.68, below its moving average of 38.42. The MACD line also remained below its signal line, at -25.29 versus -22.21, with a histogram reading of -3.08.
Support Levels Put $2,250 and $2,200 in Focus
Ethereum is testing support near $2,300, with a breakdown potentially exposing $2,250 and $2,200. Resistance is around 2,350–2,400, followed by $2,500. Darkfost described deleveraging as part of the correction process, noting that such periods can bring fear and sometimes precede a final correction phase.