Key Takeaways ETH rejected at the 50-day SMA near $1,795. First support sits at the $1,737 Fib level. Smart money sentiment reads extremely bearish. The Rejection Level ETH trades near $1,770
Key Takeaways
- ETH rejected at the 50-day SMA near $1,795.
- First support sits at the $1,737 Fib level.
- Smart money sentiment reads extremely bearish.
The Rejection Level
ETH trades near $1,770 after being turned away at its 50-day SMA around $1,795 on the TradingView chart, the level sellers have defended since the recovery began. The bounce from the late-June low near $1,510 carried price through the descending trendline and up to the moving average, but the test failed, with the daily candle down 1.7% until the time of writing.
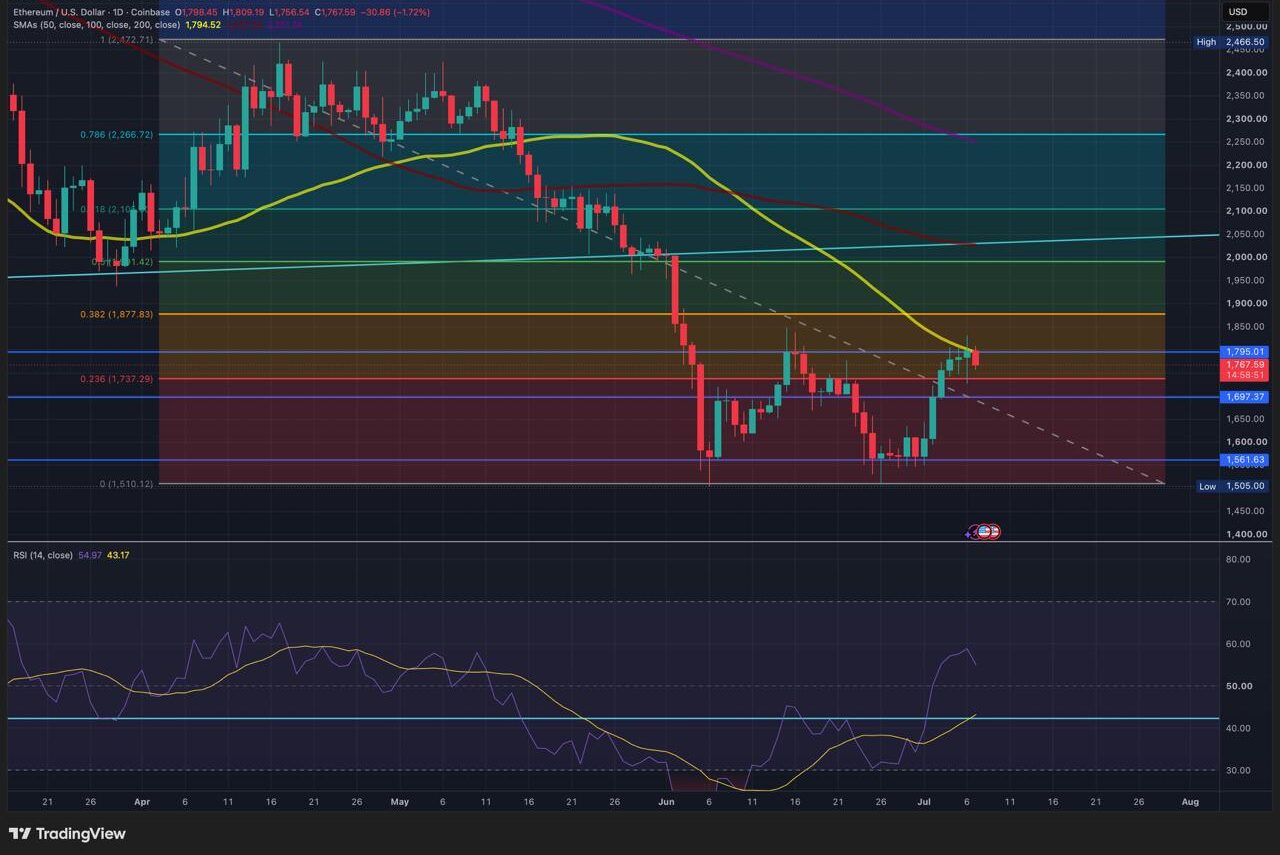
Technical analysis chart for ETH/USD, highlighting key price levels and indicators.
The levels ahead are clearly marked. First support is the 0.236 Fibonacci retracement at $1,737, and below it, the $1,700 zone. A failure there reopens the $1,561 area that formed the base of the recovery. To the upside, bulls need a daily close back above the 50-day SMA to shift momentum, with the next barrier at the 0.382 Fib near $1,878. The daily RSI at 54.97 sits just above neutral, enough to fuel the bounce but not to confirm a trend change.
What the Positioning Data Reveals
The derivatives picture explains the rejection. Across Binance, OKX, and Bybit, retail traders are positioned bullish, with long/short ratios ranging from 1.68 to 2.35 per Coinglass data. But the smart money and whale cohorts tell a different story: smart money sentiment reads extremely bearish on both Binance and Bybit, while whale positioning on OKX also flashes extremely bearish at a 0.64 ratio.
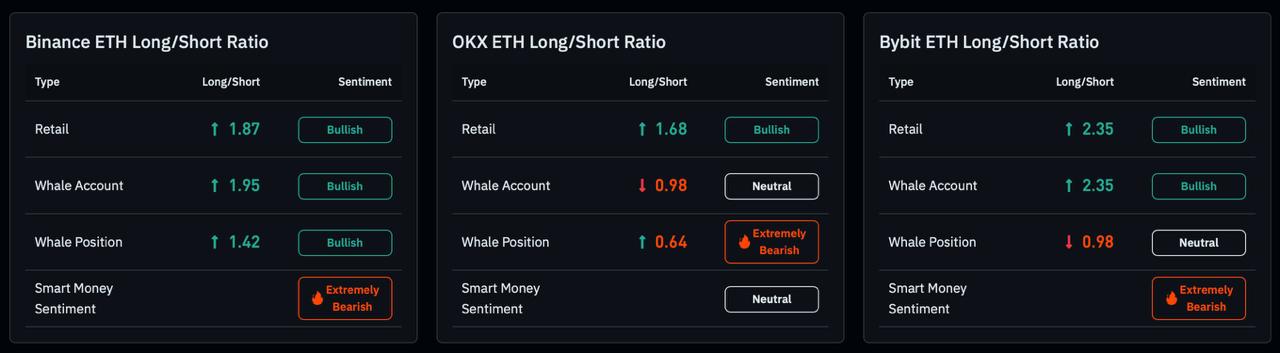
ETH long/short ratio and sentiment analysis across major exchanges.
That split, retail long while sophisticated traders lean short, is a classic caution signal. It does not guarantee a drop, but it means the crowd driving the bounce is the same cohort that tends to be positioned wrong at local tops, and the larger players are fading them exactly at the 50-day SMA rejection.
The Offsetting Signal
Spot demand cuts the other way. Ethereum ETFs recorded $20.66 million in net inflows on July 6, extending the turn that began on July 1 after eight consecutive weeks of outflows. The tension is clear: institutional spot buyers are accumulating through ETFs while leveraged whales position for downside, leaving price caught between the two forces at a well-defined technical level.
READ MORE:
 Inside One of the Boldest Ideas in Ethereum’s Lean Roadmap
So for now the chart shows rejection, the derivatives data shows large traders leaning bearish, and the ETF flows show spot demand persisting. That disagreement is why the $1,737 support and the 50-day SMA overhead matter so much: a break of the Fib level could validate the whale positioning, while a reclaim of the moving average might side with the ETF buyers. Until one gives way, ETH remains a bounce inside an unbroken downtrend, with the burden of proof still on the bulls.
This article is for informational purposes only and does not constitute financial or investment advice. Cryptocurrency markets are highly volatile. Always conduct your own research before making investment decisions.
The post Ethereum Rejected at 50-Day SMA as Whales Turn Bearish appeared first on Coindoo.