Key Takeaways: ETH dropped to $1,977, down 12.41% on the monthly candle, 4.6% daily, 7.7% weekly Bitcoin dipped to $73,000 simultaneously as Iran-US conflict escalated overnight Monthly ascen
Key Takeaways:
- ETH dropped to $1,977, down 12.41% on the monthly candle, 4.6% daily, 7.7% weekly
- Bitcoin dipped to $73,000 simultaneously as Iran-US conflict escalated overnight
- Monthly ascending trendline from 2019 still holding despite the breakdown under $2,000
- Ethereum spot ETFs recorded outflows every single day from May 11 through May 27
- SMA50 at $2,414 and SMA100 at $1,741 – price sitting between the two on monthly chart
Ethereum droped below $2,000, printing $1,977 on the monthly chart – down 12.41% on the candle, 4.6% in the past 24 hours, and 7.7% over the past week. The move happened alongside Bitcoin dropping to $73,000 as the Iran-US conflict produced its sharpest escalation in weeks. The US conducted its second round of airstrikes in three days, hitting a drone command hub in Bandar Abbas. Iran retaliated by striking an American military base at 4:50am local time. Kuwait activated air defenses. Oil moved higher. Risk assets moved lower across the board.
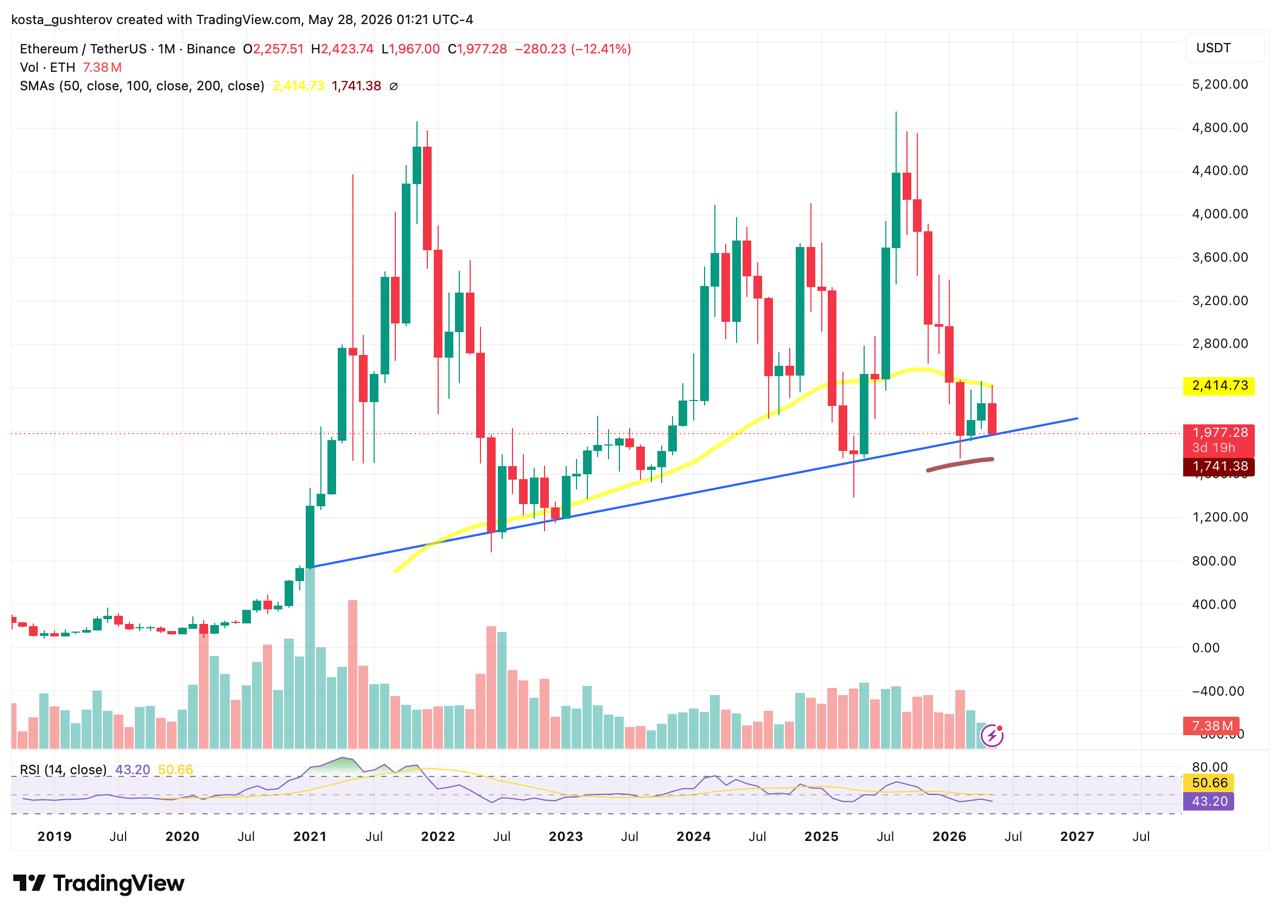
The headline number – ETH under $2,000 – looks bad. The monthly chart tells a more specific story.
The trendline that has held since 2019
The most important feature on the ETH monthly chart isn’t the current price. It’s the ascending blue trendline that connects the 2019 lows through every major cycle bottom since – running from below $100 in 2019 through the 2020 accumulation, the 2022 crash low, and the 2023-2024 recovery. That trendline currently runs through the $1,900-$2,000 area on the monthly timeframe.
Price has tested it. It hasn’t broken it. The current monthly candle, despite printing below $2,000 intraday, is sitting right on that trendline rather than below it in a confirmed breakdown. On a monthly chart, a single candle touching a trendline is not the same as a close below it. The monthly candle still has time remaining. Until it closes below the trendline on the last day of the month, the structure that has defined Ethereum’s entire macro uptrend since 2019 remains technically intact.
That distinction matters enormously for how to read the current move. A confirmed monthly close below the trendline would be a genuinely significant structural break – the kind that takes months to repair. A wick to the trendline that holds and recovers is a test of support, not a failure of it. Right now it’s the latter, not the former.
The SMA50 and SMA100 context
The monthly chart shows two visible moving averages. The SMA50 at $2,414 is declining – it has been falling since ETH peaked above $4,000 in late 2024 and is now sitting above current price as resistance. The SMA100 at $1,741 is rising from below, having curved upward through 2024 and 2025. Current price at $1,977 sits between the two – below the declining SMA50 and above the rising SMA100.
The SMA100 at $1,741 is the next meaningful technical floor below the trendline. If the trendline breaks on a monthly close, the SMA100 becomes the last line of defense before what could be much deeper reassessment of ETH’s macro position.
Twelve consecutive days of ETF outflows
The price pressure hasn’t been purely geopolitical. Ethereum spot ETFs recorded outflows every single day from May 11 through May 27 – twelve consecutive negative sessions. The daily outflow numbers tell the story: $130.62M on May 12, $86.31M on May 18, $67.15M on May 27. Even the lighter days — $5.65M on May 14, $6.67M on May 22 – produced no positive session in the entire run.
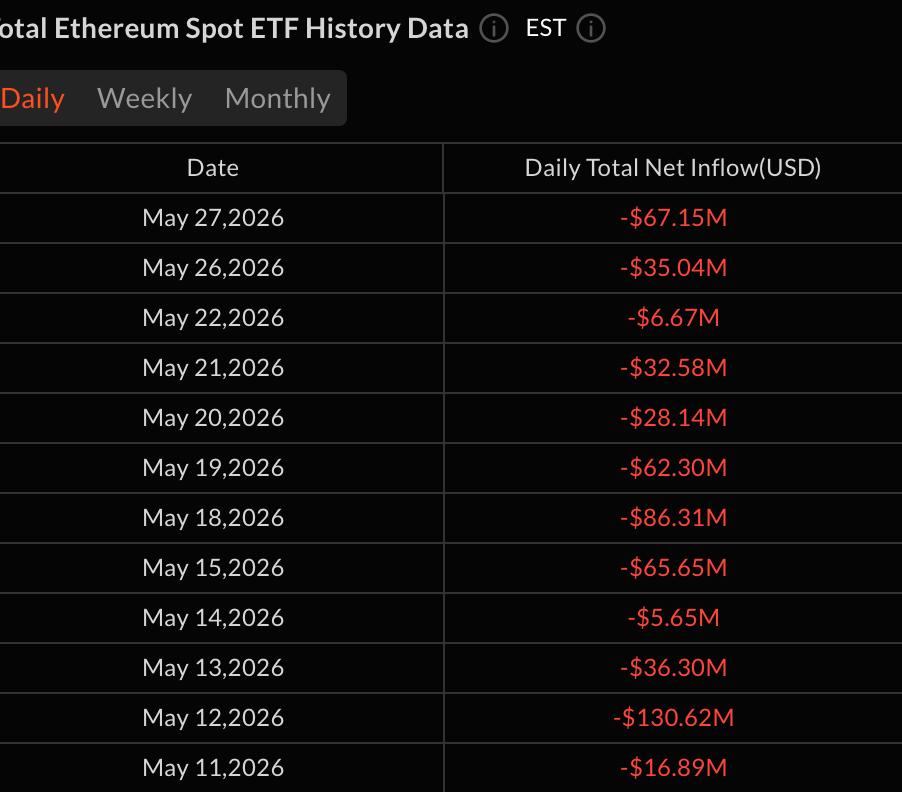
Twelve straight days of institutional outflows from Ethereum ETFs while price simultaneously tests the monthly trendline is a pressure combination that explains why $2,000 broke. The geopolitical trigger overnight accelerated a move that was already building from sustained ETF selling throughout May.
Monthly RSI at 43.20
The monthly RSI at 43.20 sits below its signal line at 50.66 – more than 7 points below. On a monthly timeframe that gap represents sustained bearish momentum rather than a short-term fluctuation. RSI hasn’t reached oversold territory near 30 on the monthly chart, which means there’s no momentum-based exhaustion signal yet at this timeframe.
But the monthly RSI being at 43 while price tests a 7-year trendline is a more constructive setup than RSI being at 43 in open space with no technical support. The trendline gives the RSI level a context it wouldn’t otherwise have.
Why this is not yet a panic situation
The case for not panicking rests on one specific fact: the monthly trendline from 2019 is still holding. Every other bear case — ETF outflows running for 12 days, declining SMA50 above price, geopolitical pressure from an escalating war, price below $2,000 – is real and valid. But all of it is happening at the exact level that has defined Ethereum’s macro support structure for seven years.
Markets punish the crowd that panics at support. The same trendline that looks scary to test from the current side looked like an obvious buy to anyone watching it hold during the 2022 crash and the 2023 lows. The structure is intact. Whether it stays intact depends on whether the Iran-US conflict de-escalates enough to remove the geopolitical pressure that broke $2,000 in the first place.
If the ceasefire holds and ETF outflows stabilize, the trendline test can be seen as a buying opportunity in retrospect. If the conflict escalates further and ETF outflows continue for another two weeks, a monthly close below the trendline becomes increasingly likely and the picture changes materially.
For now the trendline is the only number that matters on the ETH chart. It’s holding. The month isn’t over.
The information provided in this article is for educational purposes only and does not constitute financial, investment, or trading advice. Coindoo.com does not endorse or recommend any specific investment strategy or cryptocurrency. Always conduct your own research and consult with a licensed financial advisor before making any investment decisions.
The post Ethereum Sinks Under $2,000: Why Investors Should Not Panic Yet appeared first on Coindoo.