In our last gold weekly price prediction, we said the gold price needed to get back above $4,500 and then clear $4,600 to put higher targets like $4,700 and $4,800 back in play. So far, buyer
In our last gold weekly price prediction, we said the gold price needed to get back above $4,500 and then clear $4,600 to put higher targets like $4,700 and $4,800 back in play. So far, buyers have done their part.
Gold climbed back above $4,500, helped by a surge in bullish options bets, the highest in six months, and steady demand from safe-haven buyers. Traders are clearly getting more confident about where gold is headed.
Now the focus shifts to the next test: $4,632. If gold breaks above that and holds, $4,700 becomes the next target, then $4,800. If buyers stall, $4,500 becomes the key support level to watch. As long as gold stays above that, the bulls are in a good spot heading into the week.
Central Banks Are Increasing Their Gold Exposure
A recent post from Coin Bureau indicated a major milestone in the global reserve market. For the first time since 1996, central banks collectively hold more gold than U.S. Treasuries. The trend accelerated after the 2022 freeze of roughly $300 billion in Russian reserves.
That event encouraged many countries to reduce reliance on dollar-denominated assets and increase their exposure to physical gold. Coin Bureau also referenced World Gold Council data showing that nearly 75% of reserve managers expect the dollar’s share of global reserves to decline over the next five years.
If that trend continues, gold could remain an important destination for central bank purchases. For the gold price, this matters because central bank demand has become one of the strongest sources of long-term support in the market.
Read Also: If You Put $500 a Month Into Bitcoin and Gold Since 2020, You’d Have This Much Today
The Gold Price Is Testing a Key Support Area
We had a look at the gold chart and found that the metal is trading just above an important support zone. The gold price is at $4,454.99 after falling from a peak near $4,800. The latest candle traded between $4,445.46 and $4,486.84, showing that both buyers and sellers remain active.
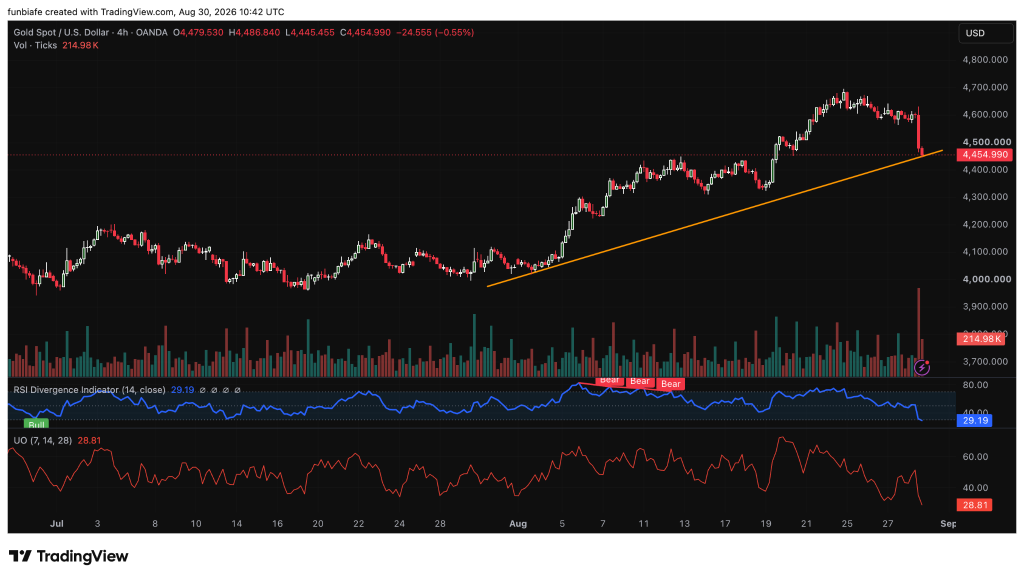 Source: TradingView
The first major support level sits at $4,400. This area has become the key line that bulls need to defend. As long as the gold price remains above it, a recovery remains possible. On the upside, resistance starts at $4,500. If buyers manage to reclaim that level, attention could quickly turn toward $4,600 and then $4,700.
The technical indicators are beginning to favor a rebound. The RSI has dropped to 29.19, placing the gold price in extremely oversold territory. Readings below 30 often appear when selling pressure is becoming exhausted.
The chart is showing bullish divergence too, RSI has been making higher lows even as price kept dropping. That’s a classic sign that the sale is losing steam. The Ultimate Oscillator is also sitting deep in oversold territory at 28.81, which backs up the idea that downside momentum could be running out of gas.
How High Can the Gold Price Go This Week?
As long as the gold price holds above $4,400, the bullish case stays alive. A push back above $4,500 would strengthen the recovery and open the door to $4,600. If momentum keeps building, traders could start eyeing $4,700, and then a retest of the $4,800 high.
The bearish scenario comes into play if $4,400 fails. In that case, the next downside targets would be $4,300 and $4,200, with the psychological $4,000 level becoming a larger support zone.
For now, the combination of strong central bank demand, an RSI reading below 30, and bullish divergence gives buyers something to work with. The $4,500 level remains the key hurdle. If the gold price can break above it this week, the odds of a larger recovery move will improve considerably.
FAQs
Could the gold price reach $5,000 soon
A move to $5,000 would likely require gold to first break and hold above $4,800. While the current trend remains bullish, traders are focused on nearer-term resistance levels before considering a move to $5,000.
Why are central banks buying more goldMany central banks have increased their gold holdings as part of reserve diversification strategies. Data cited by Coin Bureau indicates that central banks now hold more gold than U.S. Treasuries for the first time since 1996.
Subscribe to our YouTube channel for daily crypto updates, market insights, and expert analysis.
The post Here’s How High Gold Price Could Go This Week appeared first on CaptainAltcoin.


 Central banks just made gold the world's LARGEST reserve asset, and most investors have no idea it happened.For the first time since 1996, central banks hold more gold than US Treasuries, after the 2022 freeze of Russia's $300 BILLION showed the world that dollar assets can…