Hedera (HBAR) trades at roughly 0.0786 US-Dollar, and that single number frames the whole question. It sits about 68.9 percent below the twelve-month high of 0.2532 US-Dollar recorded a year
Hedera (HBAR) trades at roughly 0.0786 US-Dollar, and that single number frames the whole question. It sits about 68.9 percent below the twelve-month high of 0.2532 US-Dollar recorded a year ago, yet it has climbed around 21.7 percent off the twelve-month low of 0.0646 US-Dollar that was printed only days earlier. So the honest starting point is this: is HBAR at the current price a bargain after a brutal year, or a falling knife that has merely paused? This piece walks through the chart and the fundamentals to help you decide for yourself.
The price figures and every calculation in this article were compiled by cryptoticker.io on 24 August 2026. The market data comes from CoinMarketCap, and the moving averages, the relative strength index and the distances to the yearly extremes are derived from daily closing prices using standard formulas. Wherever we cite a level, it rests on that data set, not on a forecast.
Hedera price analysis: where the HBAR price stands now
At around 0.0786 US-Dollar, HBAR carries a market capitalisation near 3.45 billion US-Dollar and ranks 24th among all cryptocurrencies. The most important reference on the chart is the 200-day moving average, which currently sits at about 0.0920 US-Dollar. Price trades roughly 14.5 percent below that line, and as long as HBAR stays underneath it, the dominant twelve-month structure is still a downtrend, not a recovery.
The shorter picture looks friendlier. The 50-day moving average stands near 0.0708 US-Dollar, and price is about 11.1 percent above it after a sharp week. That gap between the two averages tells the story in one glance: the recent bounce is real, but it has only lifted HBAR back toward the middle of its range, not out of it. The first hurdle bulls have to clear is the 200-day line at 0.0920 US-Dollar; the floor they must defend is the recent low around 0.0646 US-Dollar.
Is the Hedera downtrend broken or just interrupted?
Over twelve months HBAR is down roughly 68.9 percent, and over the last 90 days it is still about 9.5 percent lower despite the recent rally. That is the context for the past week's move of around 21 percent and the 30-day gain near 11.5 percent: a strong short-term bounce inside a trend that has not yet reversed. A downtrend is broken not by one green week but by a higher high above a prior swing peak and a defended higher low.
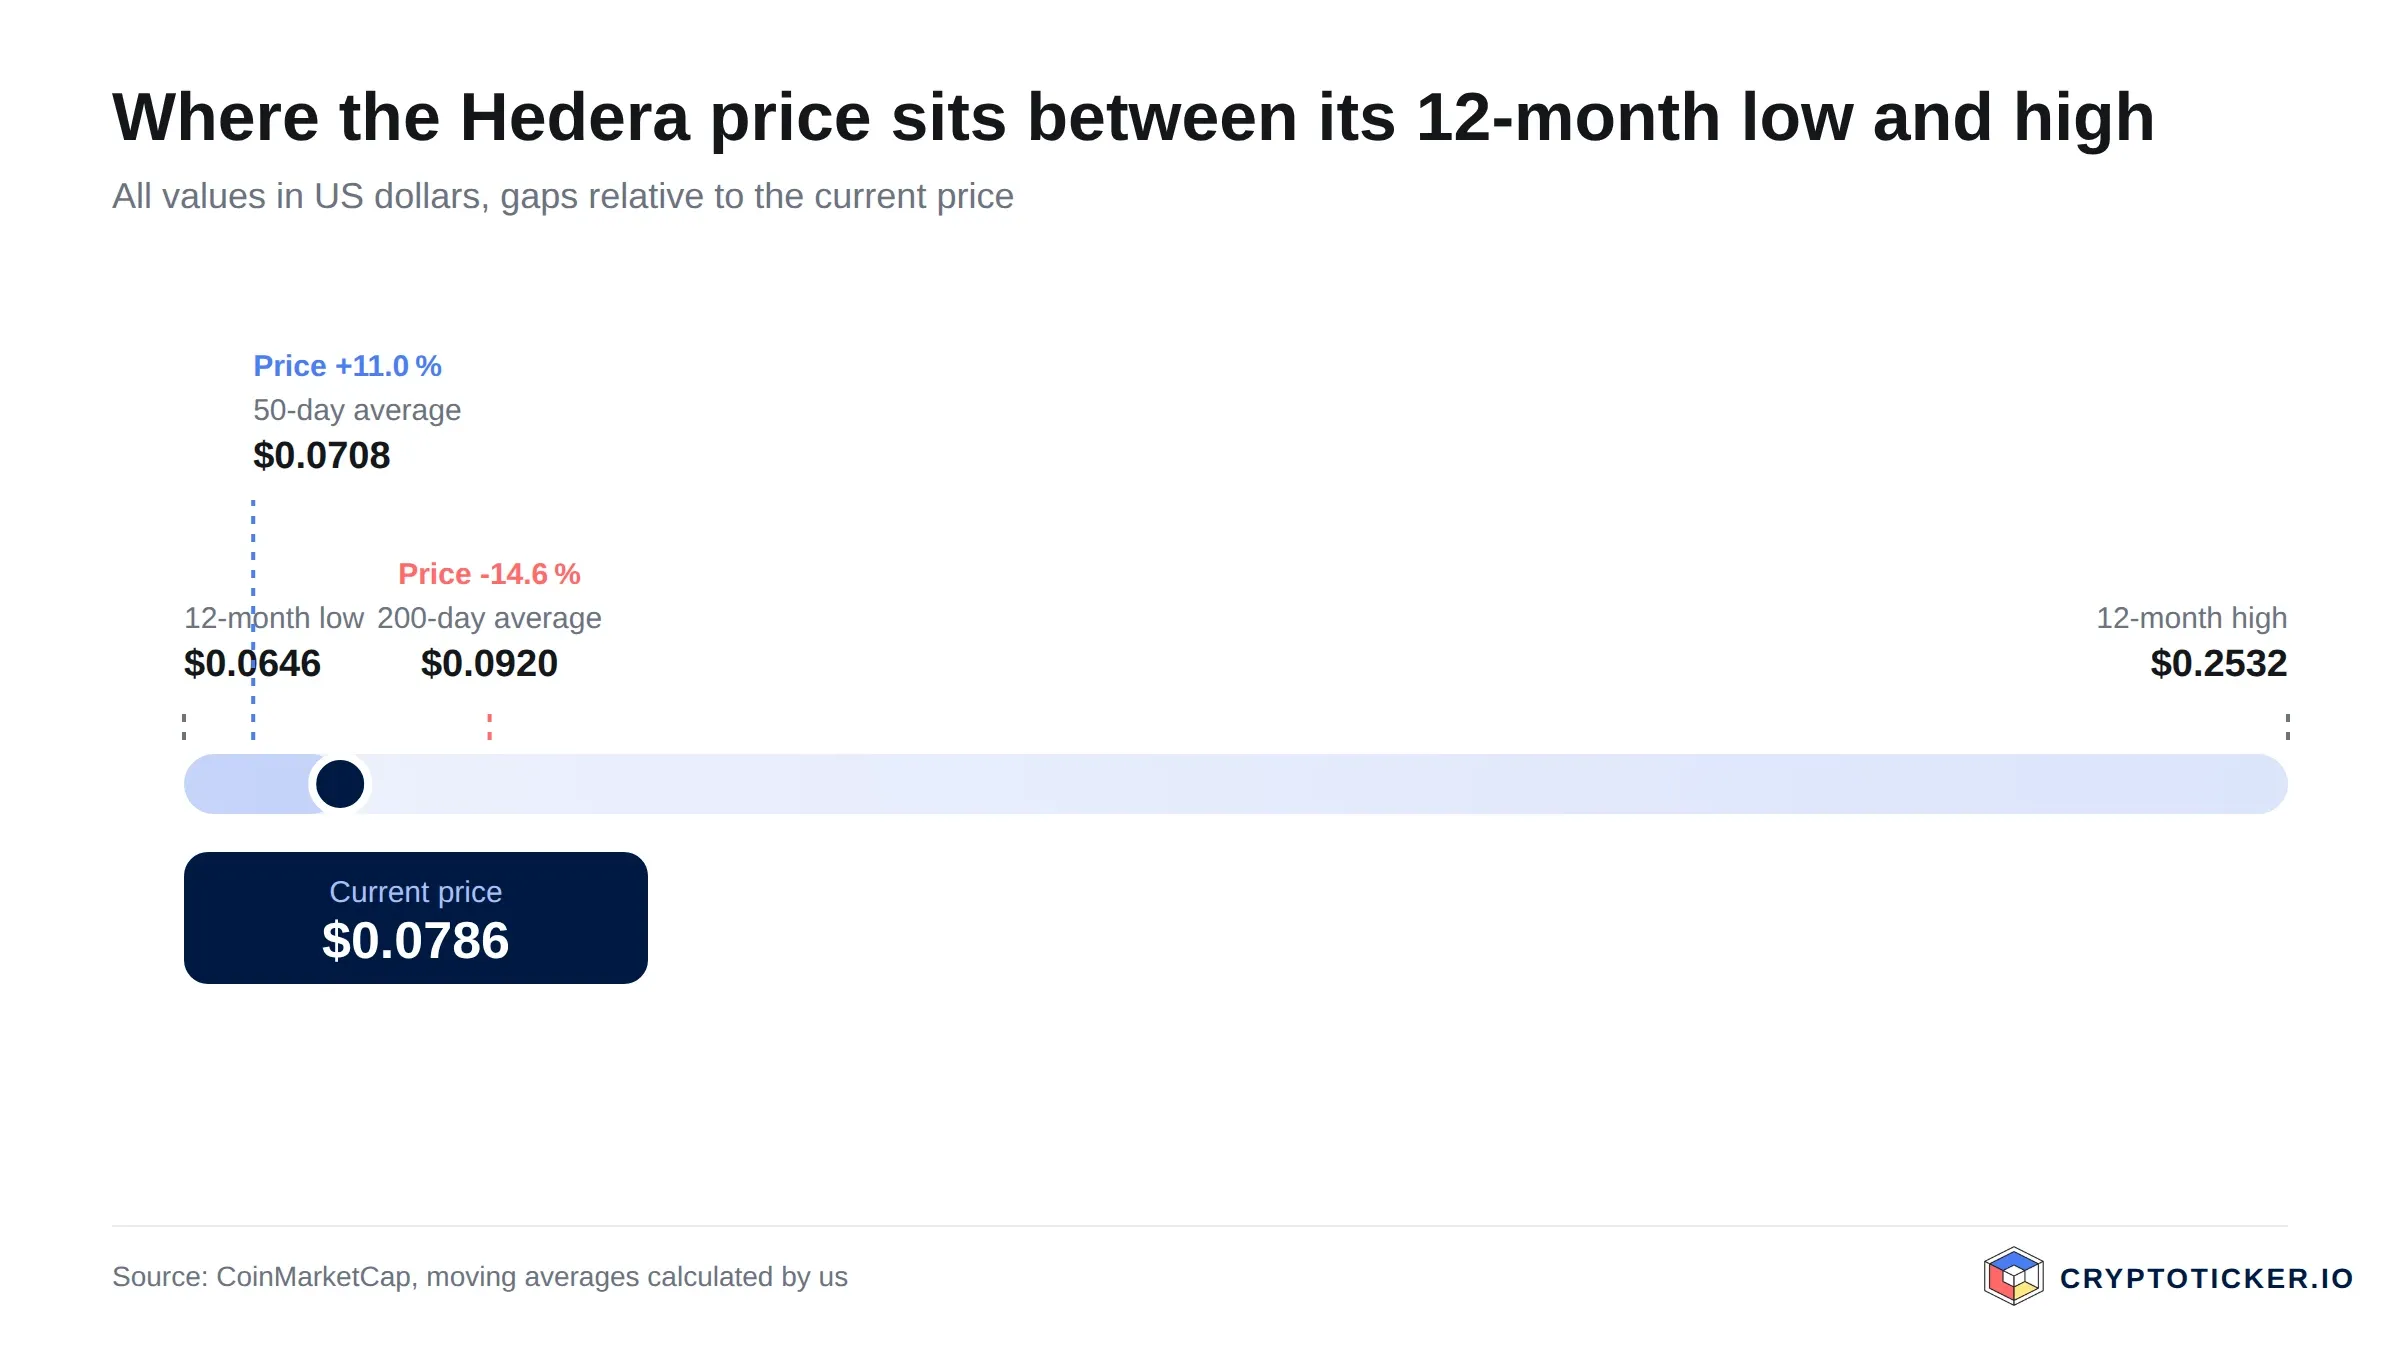
The Hedera price relative to its 12-month low, high and both moving averages
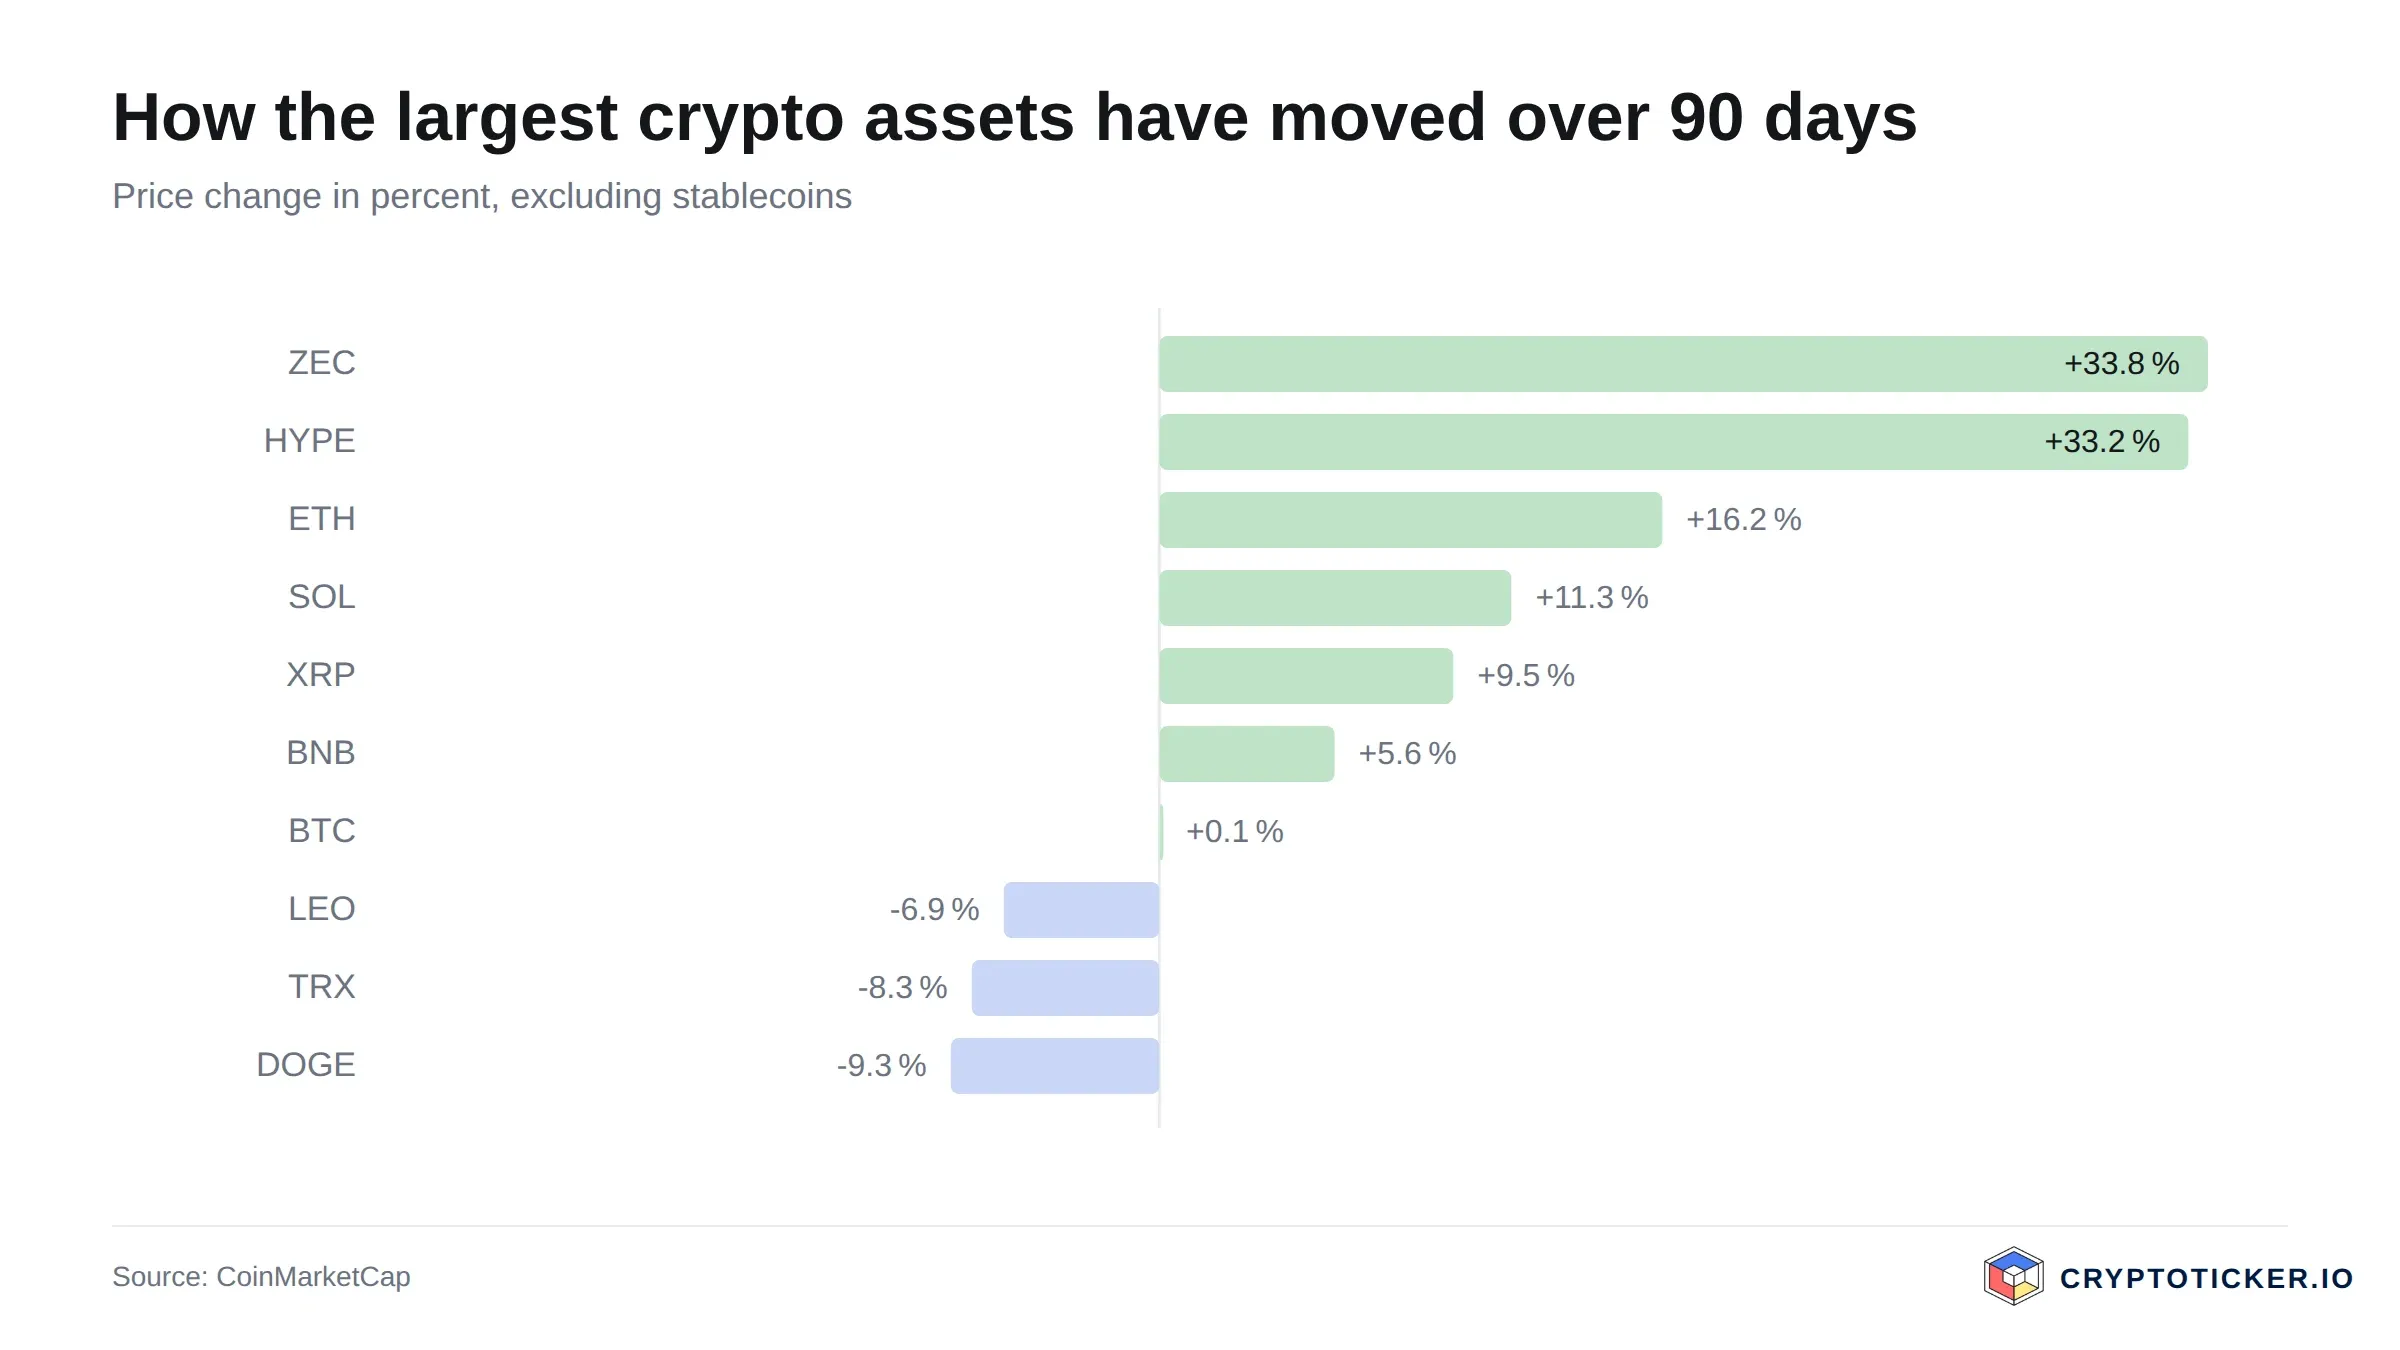
The largest crypto assets compared over 90 days, according to CoinMarketCap data
For HBAR the concrete test is the 200-day average at about 0.0920 US-Dollar. A daily close above it, followed by a successful retest that holds, would be the first technical evidence that the trend is turning rather than pausing. Until then, the more cautious reading is that the downtrend is interrupted, not over. The 21.7 percent distance to the yearly low is encouraging; the 68.9 percent distance to the yearly high is a reminder of how much ground remains.
What RSI and moving averages mean for an HBAR entry
The 14-day relative strength index sits near 68.9, close to the 70 threshold that is traditionally read as overbought. In a healthy uptrend a high RSI can stay elevated for weeks, but after a 21 percent weekly surge it is a caution flag: it suggests the easy part of the bounce may be done and that chasing green candles here carries above-average risk of an immediate pullback.
Combining the two tools sharpens the picture. Price above the 50-day average at 0.0708 US-Dollar but below the 200-day average at 0.0920 US-Dollar, with RSI near 69, describes a market that has rebounded strongly but has not yet proven a new trend. Patient buyers often prefer to wait for a cooler RSI and a pullback toward the rising 50-day line rather than buy into stretched momentum. None of this is timing advice; it is simply what the indicators describe.
What trading volume reveals about demand for Hedera
Over the past 24 hours HBAR turned over roughly 95 million US-Dollar, which is about 2.8 percent of its market capitalisation. That ratio is modest. In the strongest rallies you want to see volume expand as price rises, confirming that fresh money is doing the buying. A 21 percent weekly move on a volume-to-cap ratio under three percent points more to a relief bounce and short covering than to a wave of new long-term demand.
Volume matters because it separates a durable move from a squeeze. If HBAR approaches the 200-day average at 0.0920 US-Dollar on rising turnover, the breakout attempt deserves more trust. If it stalls there on thinning volume, the odds favour rejection and another test of support. For anyone weighing an entry, the volume behaviour around that 0.0920 line is worth watching more closely than the price alone.
What structural factors speak for Hedera
Beyond the chart, Hedera's investment case rests on its design and its supply. The network uses a hashgraph consensus rather than a conventional blockchain and is governed by a council of large organisations, a structure aimed squarely at enterprise and institutional use. You can read the project's own description of the network and its token at hedera.com.
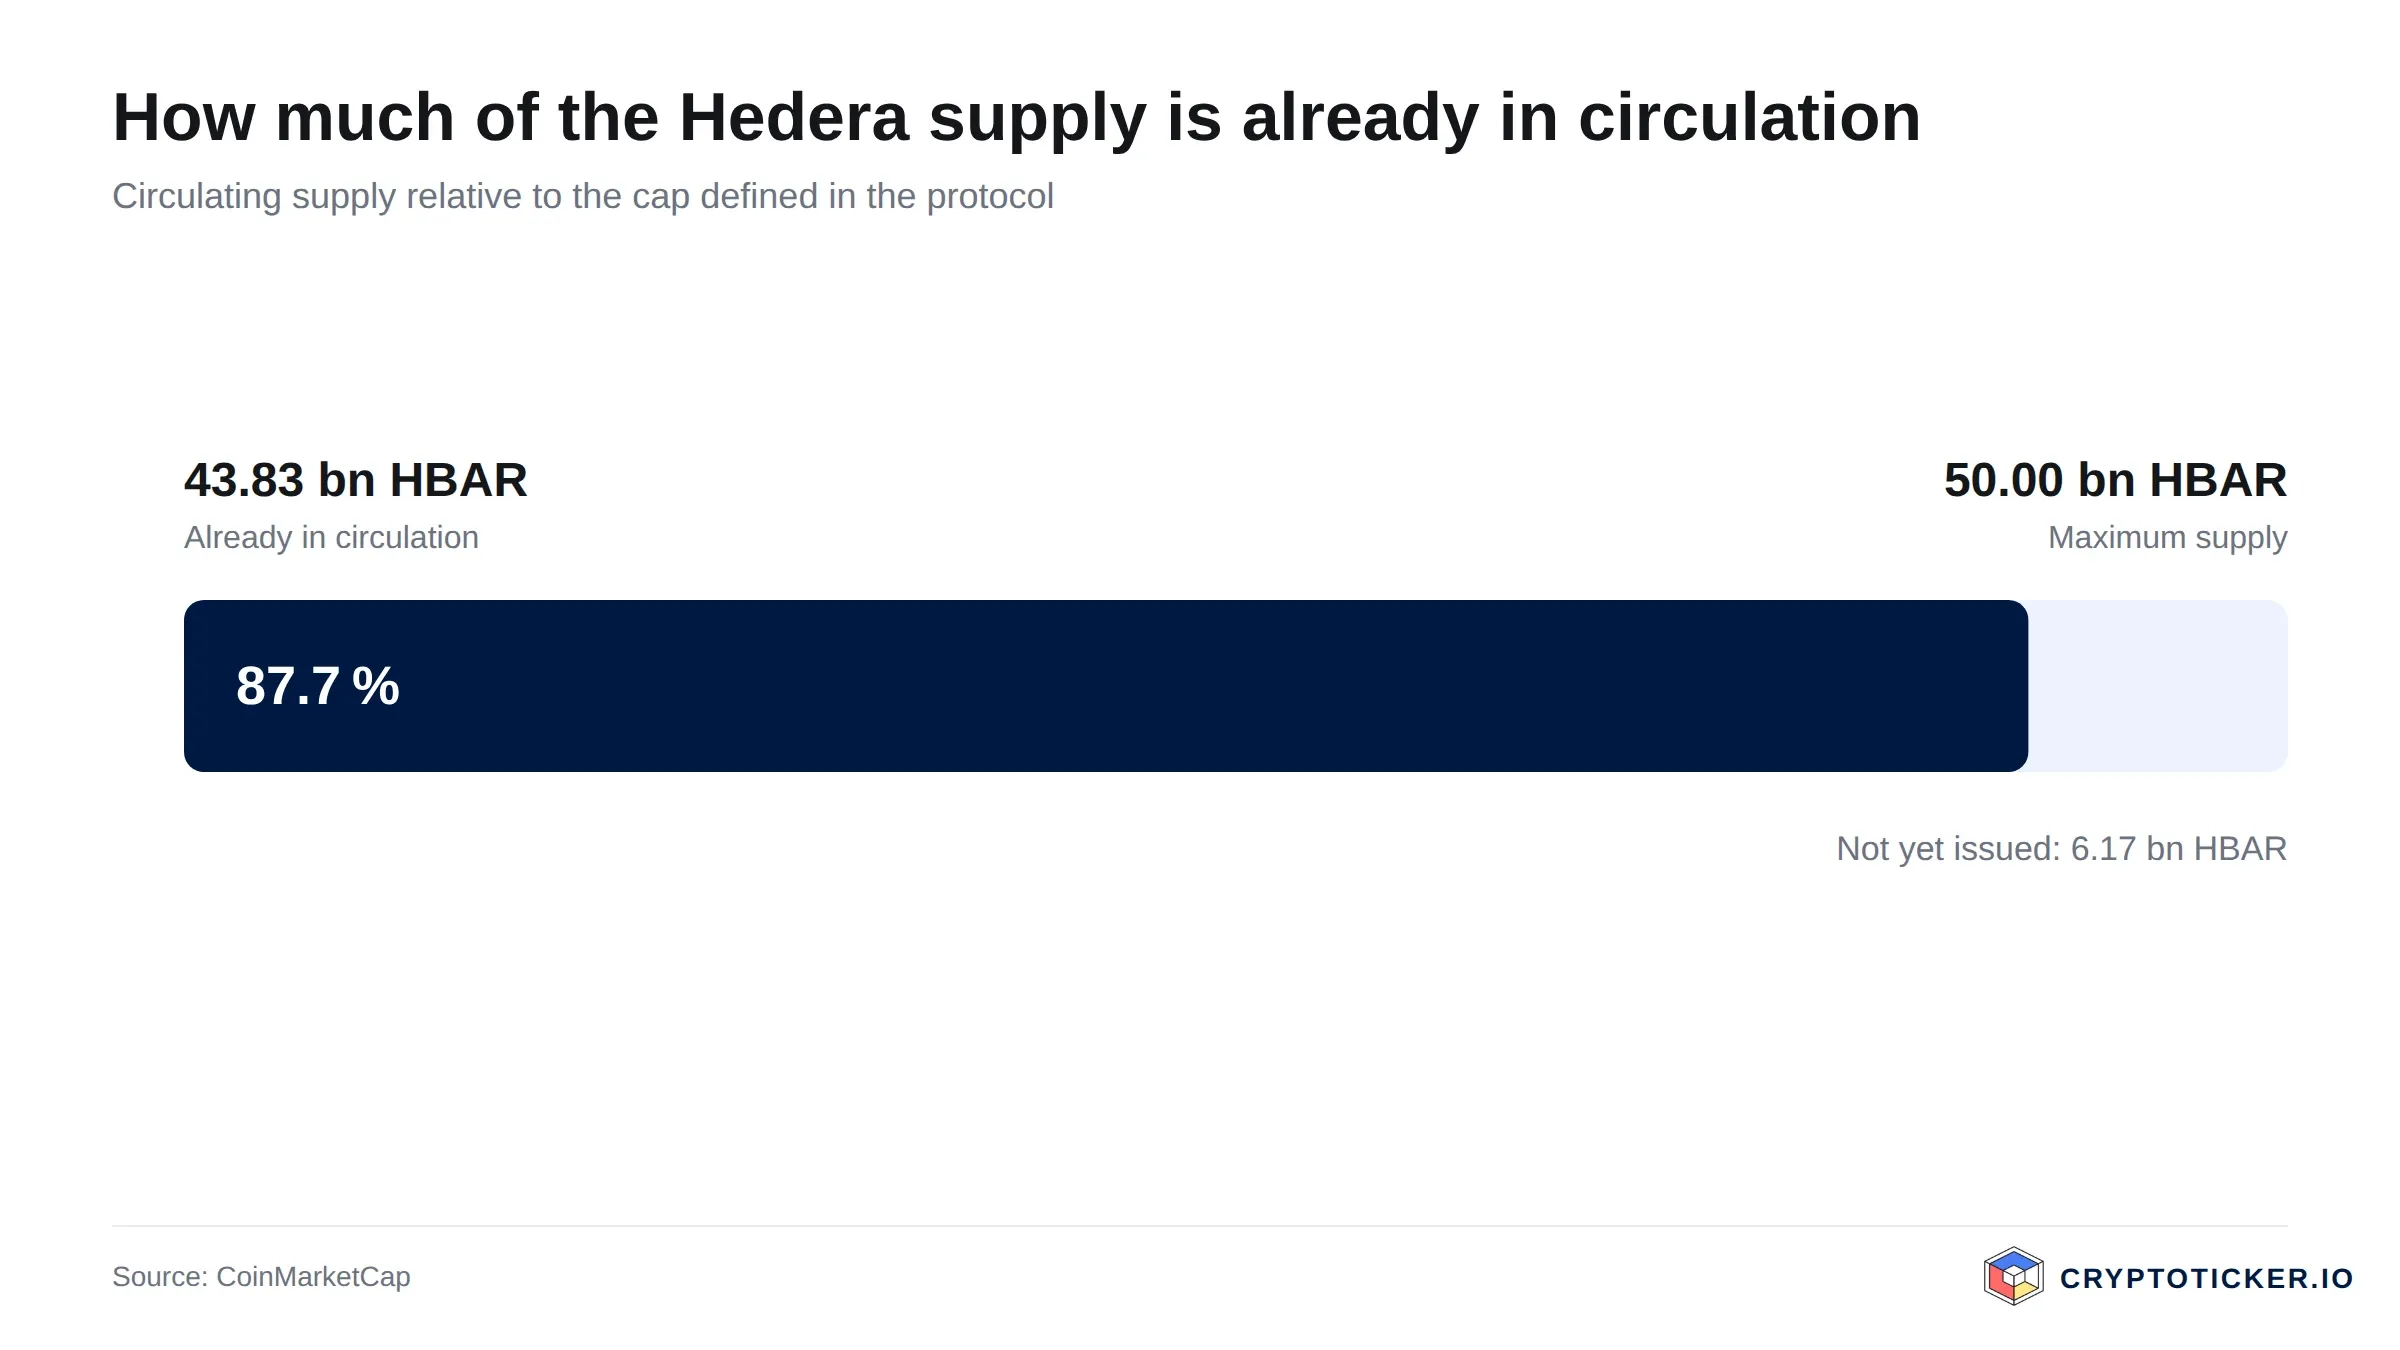
Hedera supply structure according to CoinMarketCap data
The token economics are unusually transparent. HBAR has a fixed maximum supply of 50 billion tokens, of which roughly 43.8 billion already circulate. That means about 88 percent of all HBAR that will ever exist is already in the market, so future dilution from unlocks is comparatively limited next to many rival smart-contract tokens. For a long-term buyer, a hard cap and a high circulating share are structural positives, because they cap the supply-side pressure that quietly erodes many crypto prices.
Regulation is the other structural axis. Under the EU's MiCA framework, supervised by bodies such as ESMA, tokens with clear governance and disclosure stand on firmer ground in Europe than anonymous projects. Hedera's council model fits that direction of travel, which is a modest long-term tailwind rather than a near-term price driver.
What speaks for buying Hedera at the current price
Three points make the bull case at 0.0786 US-Dollar concrete. First, valuation: HBAR trades about 68.9 percent below its yearly high, so a buyer today is paying a fraction of what the market paid a year ago for the same token. Second, momentum has turned up in the short term, with price back above the 50-day average at 0.0708 US-Dollar and a 21 percent weekly gain showing that demand can still return quickly. Third, the supply picture is clean: a fixed 50 billion cap with roughly 88 percent already circulating limits future dilution.
Put together, the argument for buying is that you are accumulating a top-25 asset far below its highs, at a moment when the shorter-term trend has begun to improve and the token's structure works in a holder's favour over time.
What speaks against buying Hedera at the current price
The bear case is just as concrete. First, the primary trend is still down: price sits about 14.5 percent below the 200-day average at 0.0920 US-Dollar, and over 90 days HBAR is still roughly 9.5 percent lower. Second, momentum is stretched, with RSI near 68.9 after a 21 percent week, which historically raises the odds of a near-term pullback. Third, demand looks thin, with 24-hour volume near just 2.8 percent of market cap, so the rally lacks the heavy participation that usually underpins a durable low.
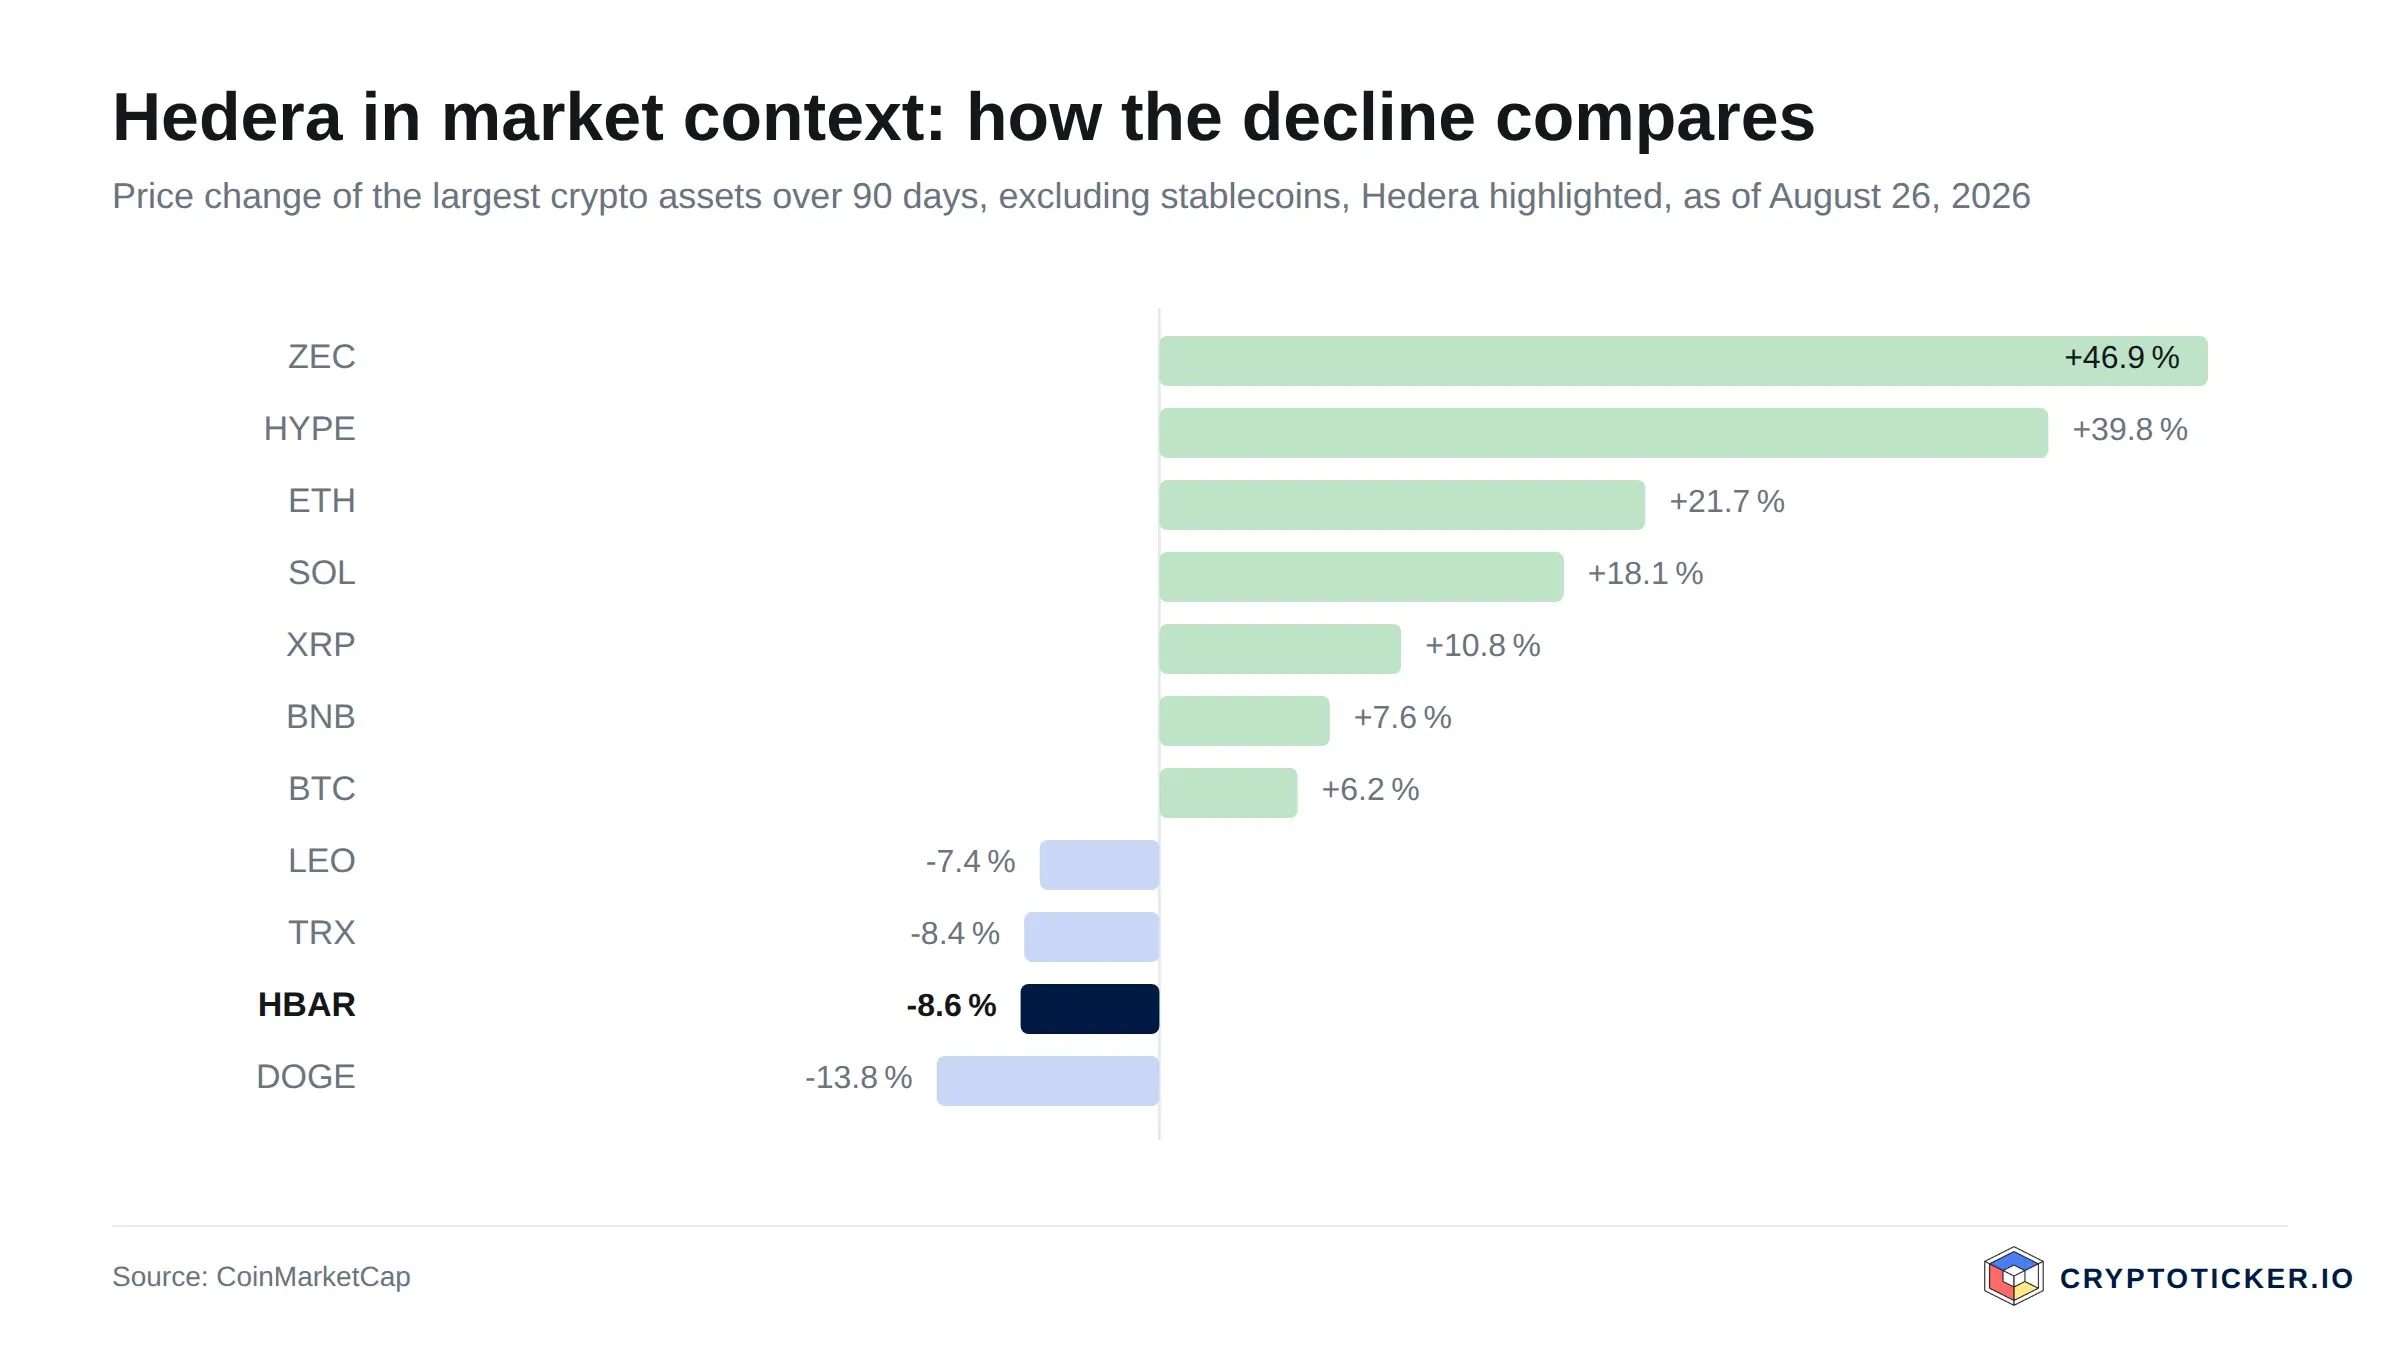
Hedera compared with the other large crypto assets over 90 days
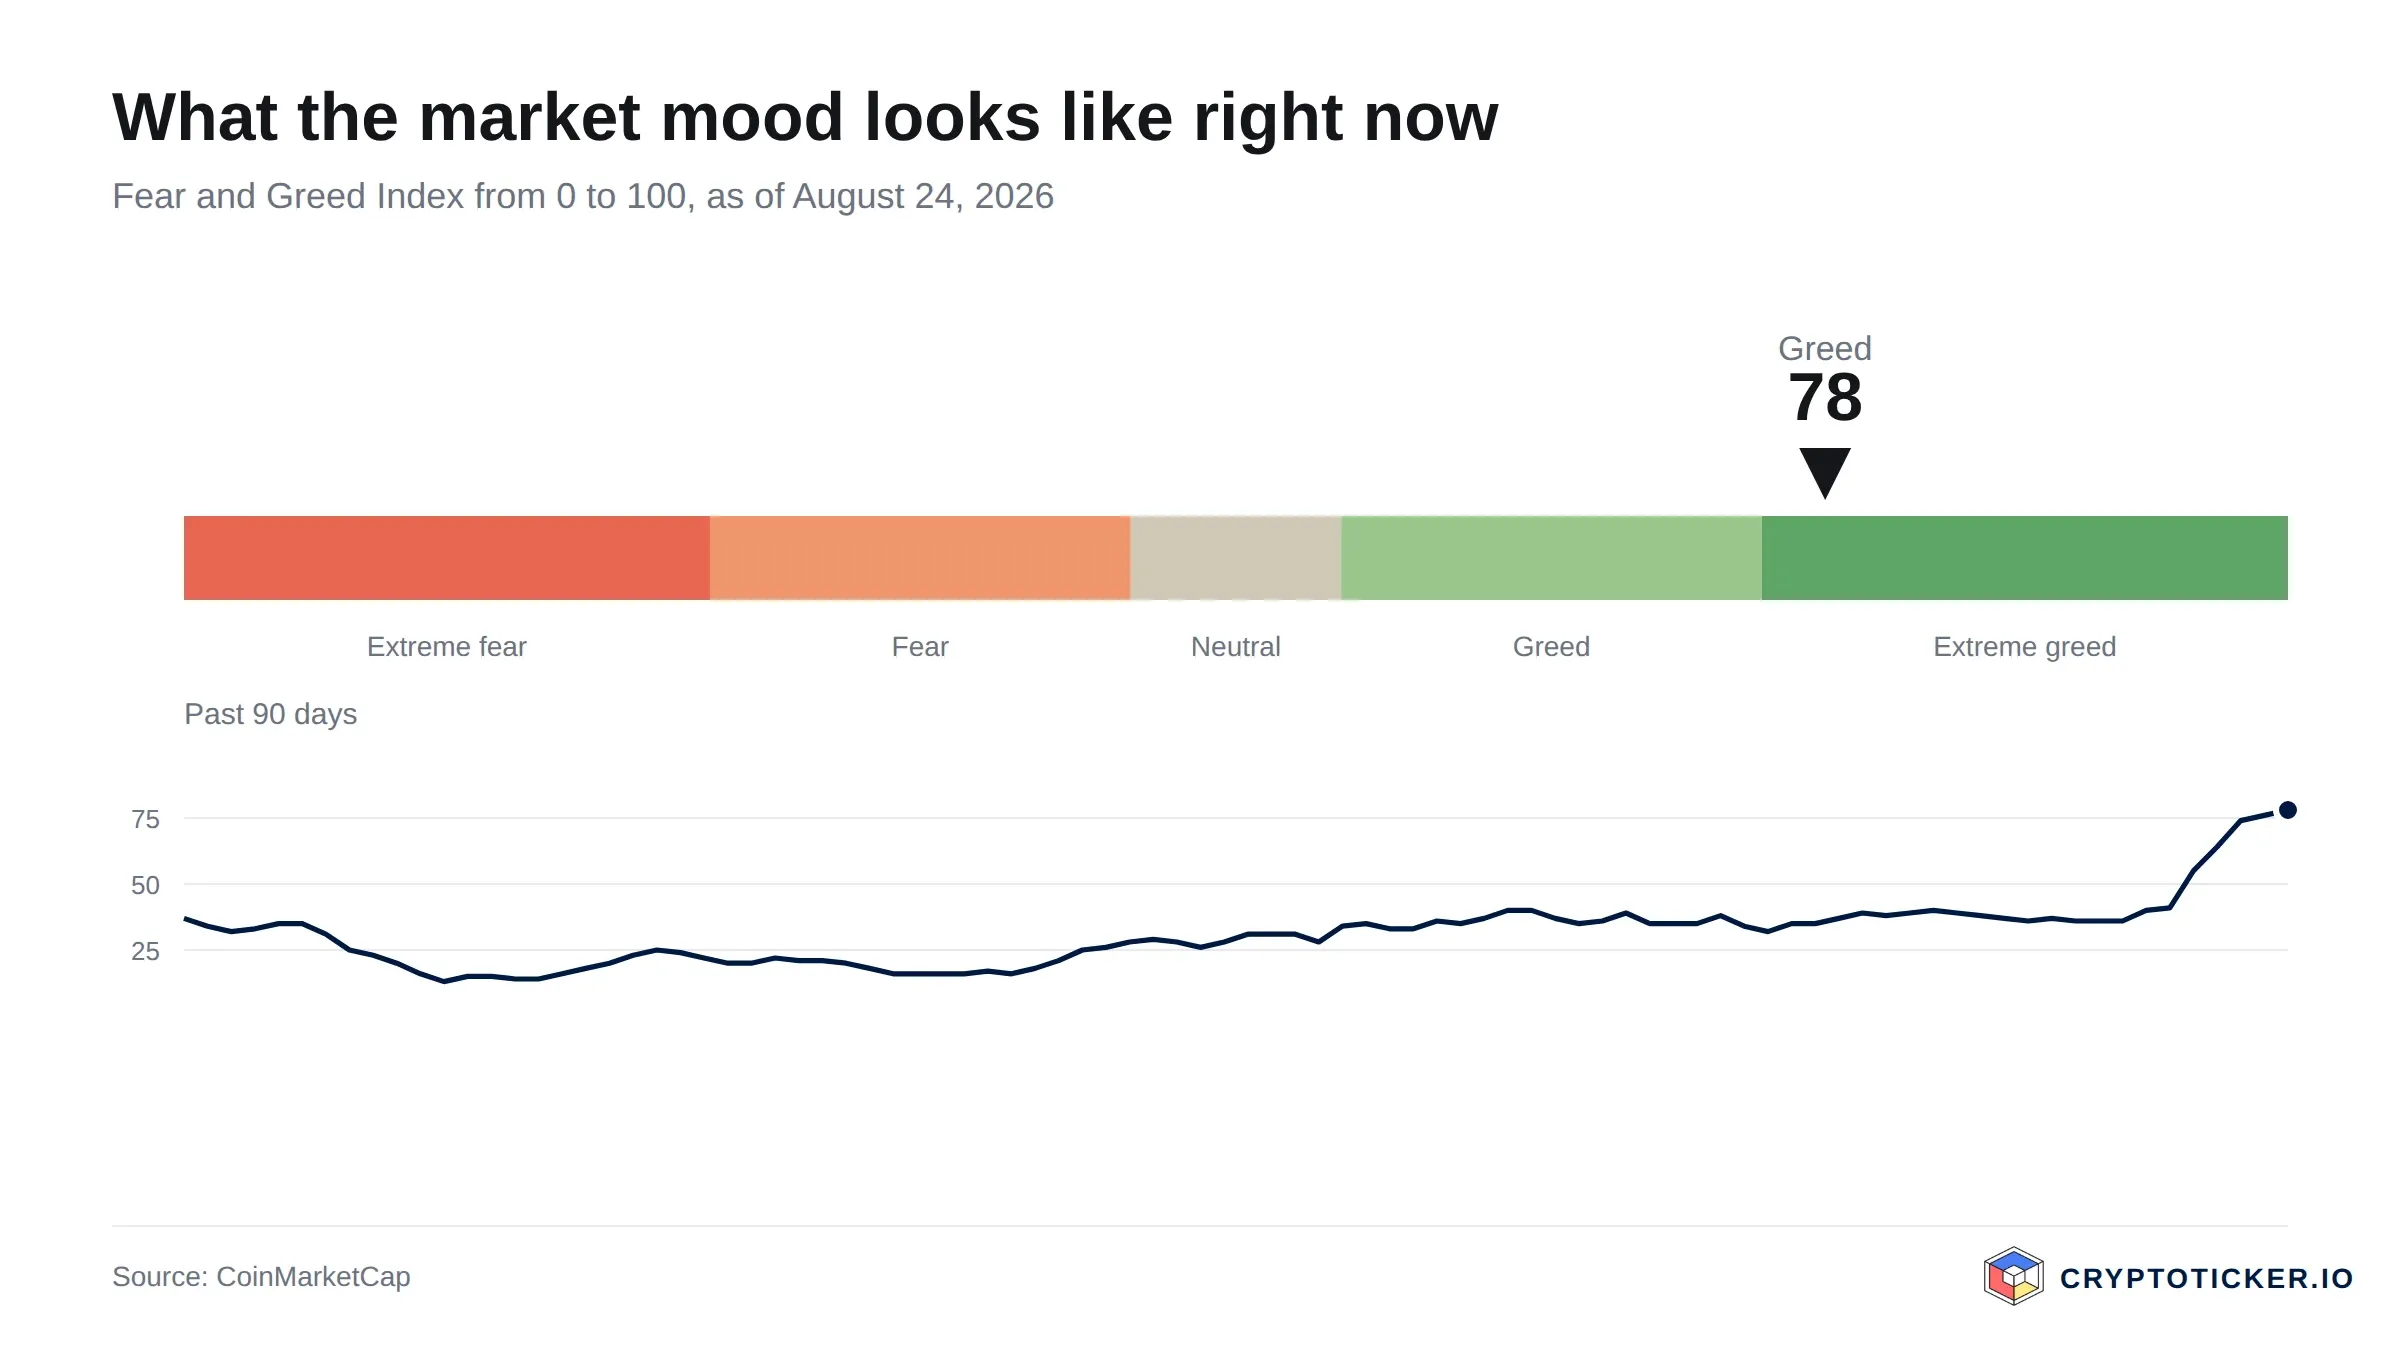
The Fear and Greed Index places market sentiment between extreme fear and extreme greed
The sober reading is that buying here means buying into a bounce inside a downtrend, on light volume, with the price already testing the upper part of its short-term range. That is a very different risk profile from buying a confirmed reversal.
How to buy Hedera (HBAR) at the current price
If you decide HBAR fits your plan, the practical steps are straightforward. HBAR is listed on most major exchanges, so the first choice is where to buy. Regulated European venues are the usual starting point; our crypto exchange comparison lays out fees and features side by side, and if regulation is your priority the comparison of regulated exchanges narrows the field further. For a specific venue, our Kraken review and Bitpanda review walk through account opening, fees and supported features in detail.
Costs matter more than they look. Watch the trading fee, the spread and any deposit or withdrawal charge, because on a small position these can quietly add up to several percent. For holding rather than trading, moving HBAR off the exchange into self-custody reduces counterparty risk; our hardware wallet comparison explains the trade-offs between convenience and security. If you would rather keep tokens on a platform and earn a yield, compare the terms first in our staking platform comparison, and remember that a higher advertised rate usually reflects higher risk.
So is Hedera a good buy at the current price?
The chart and the fundamentals point in different directions depending on your horizon. In the short term, the picture is cautious: HBAR near 0.0786 US-Dollar sits below its 200-day average at 0.0920 US-Dollar, RSI is stretched near 68.9, and volume is light, so the risk of a pullback toward the 50-day line at 0.0708 US-Dollar or the recent low at 0.0646 US-Dollar is real. A short-term buyer is betting that the bounce continues straight through the 200-day line, which is the less probable path from here.
Over a longer horizon the case is more balanced. A price about 68.9 percent below the yearly high, a hard 50 billion supply cap with most tokens already circulating, and a governance model built for institutional use are genuine long-term positives. The assumption that HBAR is undervalued would be weakened if price loses the 0.0646 US-Dollar low on rising volume, and it would be strengthened if HBAR reclaims the 0.0920 US-Dollar average and holds it on a retest. Those are the levels that decide the thesis, not a single week's candle.
Buying Hedera: what to take away
- Respect the 200-day average at 0.0920 US-Dollar: while HBAR trades below it, the twelve-month trend is still down, a point our HBAR price prediction tracks in more detail.
- Mind the entry conditions: RSI near 68.9 and light volume argue for patience over chasing, and the crypto exchange comparison helps you keep trading costs low whenever you do act.
- Match the venue to your goal: compare regulated platforms in the comparison of regulated exchanges for buying, and weigh self-custody in the hardware wallet comparison for holding.
Disclosure: Some of the providers mentioned in this article work with us through partner programmes. This has no influence on the price analysis or the assessment of the chart situation; the price data comes from a public market-data source and can be verified there.
(As of 24 August 2026. This article is not investment advice. Prices, fees and conditions change; check them with the provider before every purchase. Crypto assets are subject to high price volatility, and a total loss is possible.)