A small-cap token that spent months going nowhere just woke up, and the chart is telling a story most traders almost missed. Orochi Network Breaks Six Months of Silence With Surprise Rally Or
A small-cap token that spent months going nowhere just woke up, and the chart is telling a story most traders almost missed.
Orochi Network Breaks Six Months of Silence With Surprise Rally
Orochi Network price prediction talk is spreading fast today, and there's a reason for that. This is a coin that spent close to half a year grinding sideways near its lows, quietly building something under the surface while nobody was watching.
Then, almost overnight, it woke up.
The kind of move that happened this week doesn't come from nowhere. There's usually a build-up, a slow accumulation phase, and a base that forms while retail traders lose interest and stop checking the chart.
That's exactly what seems to have happened here.
And now the question everyone's asking is whether this is the start of something bigger or just another crypto pump that fades in a few days.
We've seen coins do both. So which one is Orochi Network turning out to be?
Key Takeaways
ON trades near $0.1765, up roughly 32% in 24 hours and 47% over the past week
Price has broken out of a multi-month ascending channel on the 4-hour chart
The weekly chart shows a completed rounded bottom pattern, a bullish reversal setup
RSI sits at 68 on the 4H chart and 60 on the weekly, both showing strength without being deep in overbought territory
Immediate resistance sits at $0.194, with the next major zone at $0.2565
Immediate support sits near $0.170, with the ascending channel's base support around $0.112
The top 5 wallets control 78% of total supply, a serious concentration risk
Short liquidations have outpaced longs across every timeframe in the past 24 hours
Table of Contents
What Is Orochi Network
Why Is $ON Price Up Today
Orochi Network Price Prediction Today
Technical Analysis: The 4-Hour Breakout
Weekly Chart: Rounded Bottom and Momentum
On-Chain Data: Whale Concentration Risk
Derivatives and Liquidation Data
Exchange Volume and Liquidity
Tokenomics and Supply
Price Prediction Table: Bull, Base, and Bear Case
Long-Term Outlook Into 2026
Key Risks and Invalidation Levels
Glossary
What Is Orochi Network
Orochi Network (ON) is a project building what it calls zkDatabase, a verifiable data layer meant to serve finance, identity systems, supply chains, and on-chain markets. The pitch is simple: as more industries digitize, they all run into the same wall, needing data that can be proven, not just accessed. It's a theme showing up across the wideraltcoin market landscape this year.
That's the gap Orochi Network says it's filling.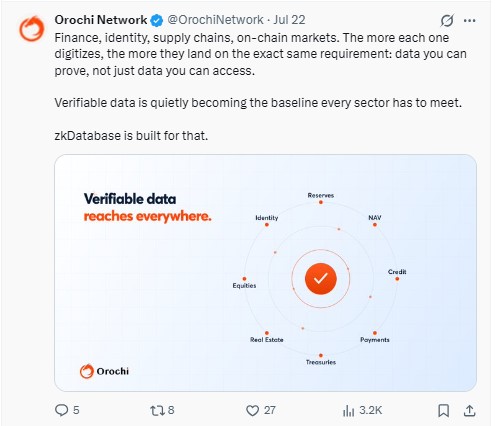
On July 22, theproject's official account laid out this thesis directly, framing verifiable data as a baseline requirement moving into finance, identity, real estate, treasuries, credit, payments, and reserves. It's a broad claim. But the timing, right before this price surge, is hard to ignore.
Why Is $ON Price Up Today
Here's the thing: there's no single headline explaining this move. No exchange listing announcement, no partnership press release, nothing loud.
What we're looking at instead is a slow accumulation phase that finally broke.
The weekly chart shows ON forming a rounded bottom over roughly five months, climbing gradually off a low near $0.06 while volume built underneath. That's the kind of pattern that often ends in a sharp move once the base completes.
And that's what happened. Price cleared its descending resistance trendline, then kept climbing inside a rising channel on the 4-hour chart, adding 32% in a single day.
The narrative push around zkDatabase seems to have added fuel at the right moment. It also lines up with abroader crypto market rally that's been lifting risk appetite across small caps. Timing matters here.
Orochi Network Price Prediction Today
ON trades at $0.1765 as of this writing, up 32.91% over 24 hours and roughly 47% over the past seven days, perlive CoinMarketCap data. Market cap sits near $25.47 million, with $13.55 million in 24-hour volume, a healthy 53% volume-to-market-cap ratio that shows real trading interest, not a thin, easily manipulated market.
The base case over the next 24 to 48 hours points to consolidation between $0.165 and $0.194, as the price tests the resistance zone that capped it back in April and May, a setup similar to thebull-bear base case framework used for larger caps. A clean break above $0.194 opens the door toward $0.2565. A rejection sends the price back toward the rising channel's support, near $0.145 to $0.150.
The chart does not lie.
RSI (Relative Strength Index, a momentum gauge that runs from 0 to 100 and flags overbought conditions above 70) reads 68.38 on the 4-hour chart. Strong, but not yet flashing exhaustion.
Technical Analysis: The 4-Hour Breakout
When we pulled up the4-hour TradingView chart, the first thing that stood out was how clean the ascending channel looks. Price respected both the rising support and resistance trendlines for close to a week before finally punching through the upper boundary.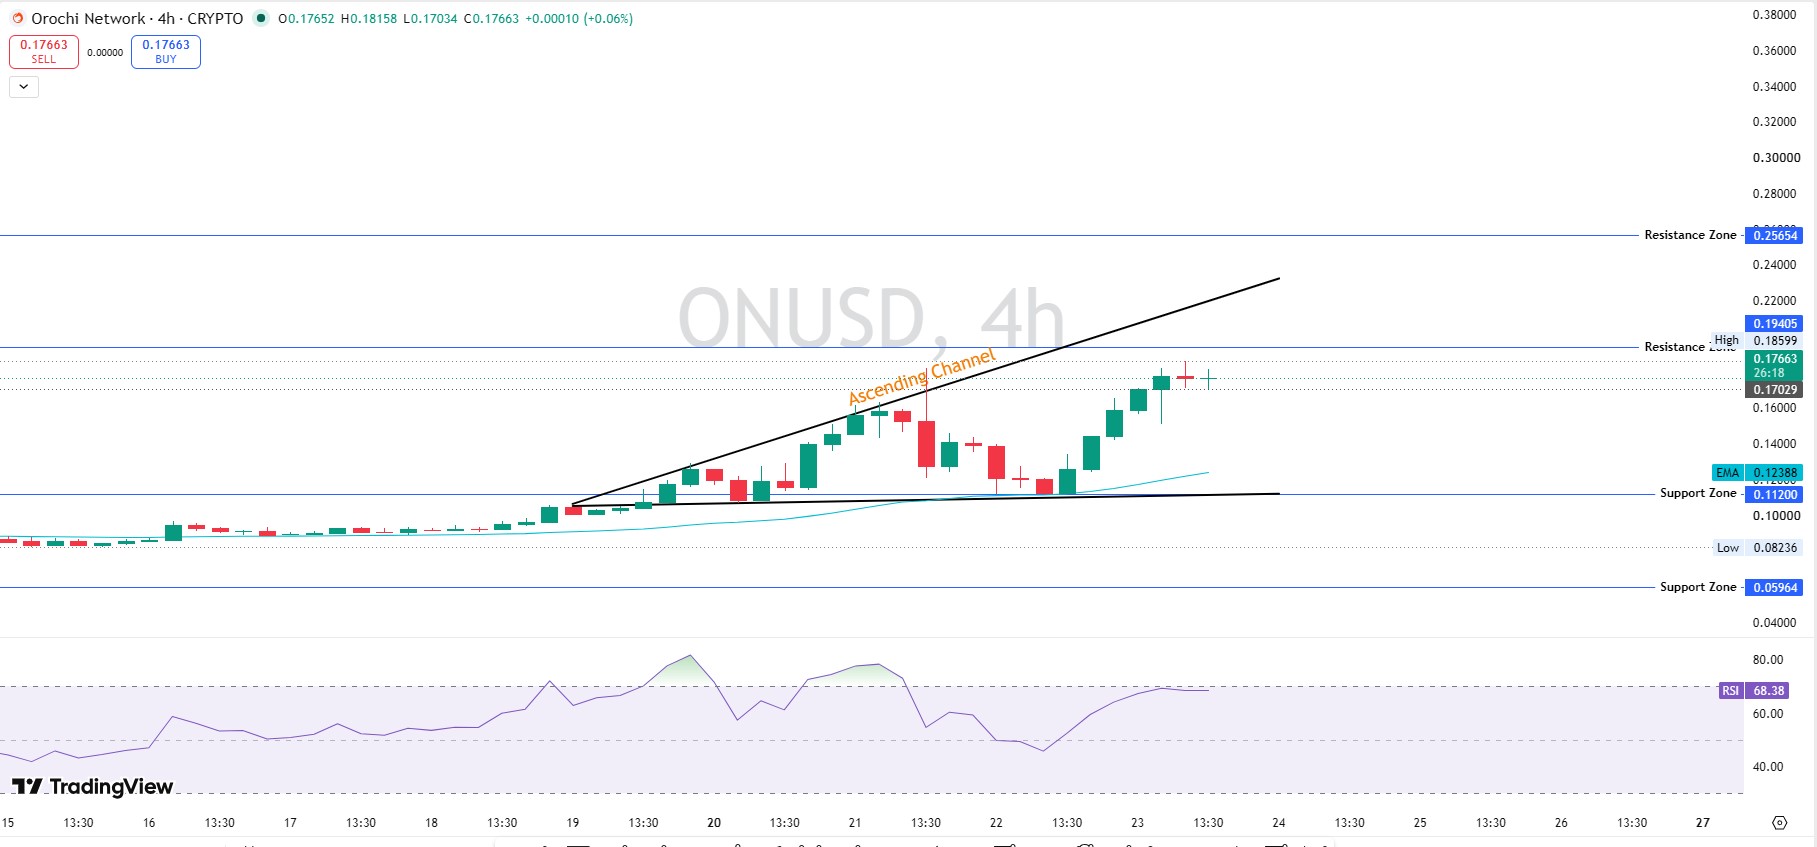
The candle that broke out came on rising volume, with green candles outnumbering red ones through the whole move. That's not a random spike. That's buyers stepping in with conviction, the kind of bullish breakout setup that shows up across other majors too.
Current resistance sits at $0.19405, a level price already tagged intraday before pulling back slightly to $0.17663.
Support now sits at $0.17029, the former resistance-turned-support zone from the breakout candle itself. Below that, the 4H EMA (Exponential Moving Average, a trend line that reacts faster to recent prices than a simple average) sits near $0.124, marking the next real cushion if this pullback deepens.
Turns out, this is about as clean a bullish structure as small-cap charts get. Higher lows, a defined channel, a volume-backed breakout.
Weekly Chart: Rounded Bottom and Momentum
Zoom out to the weekly chart, and the picture gets more interesting.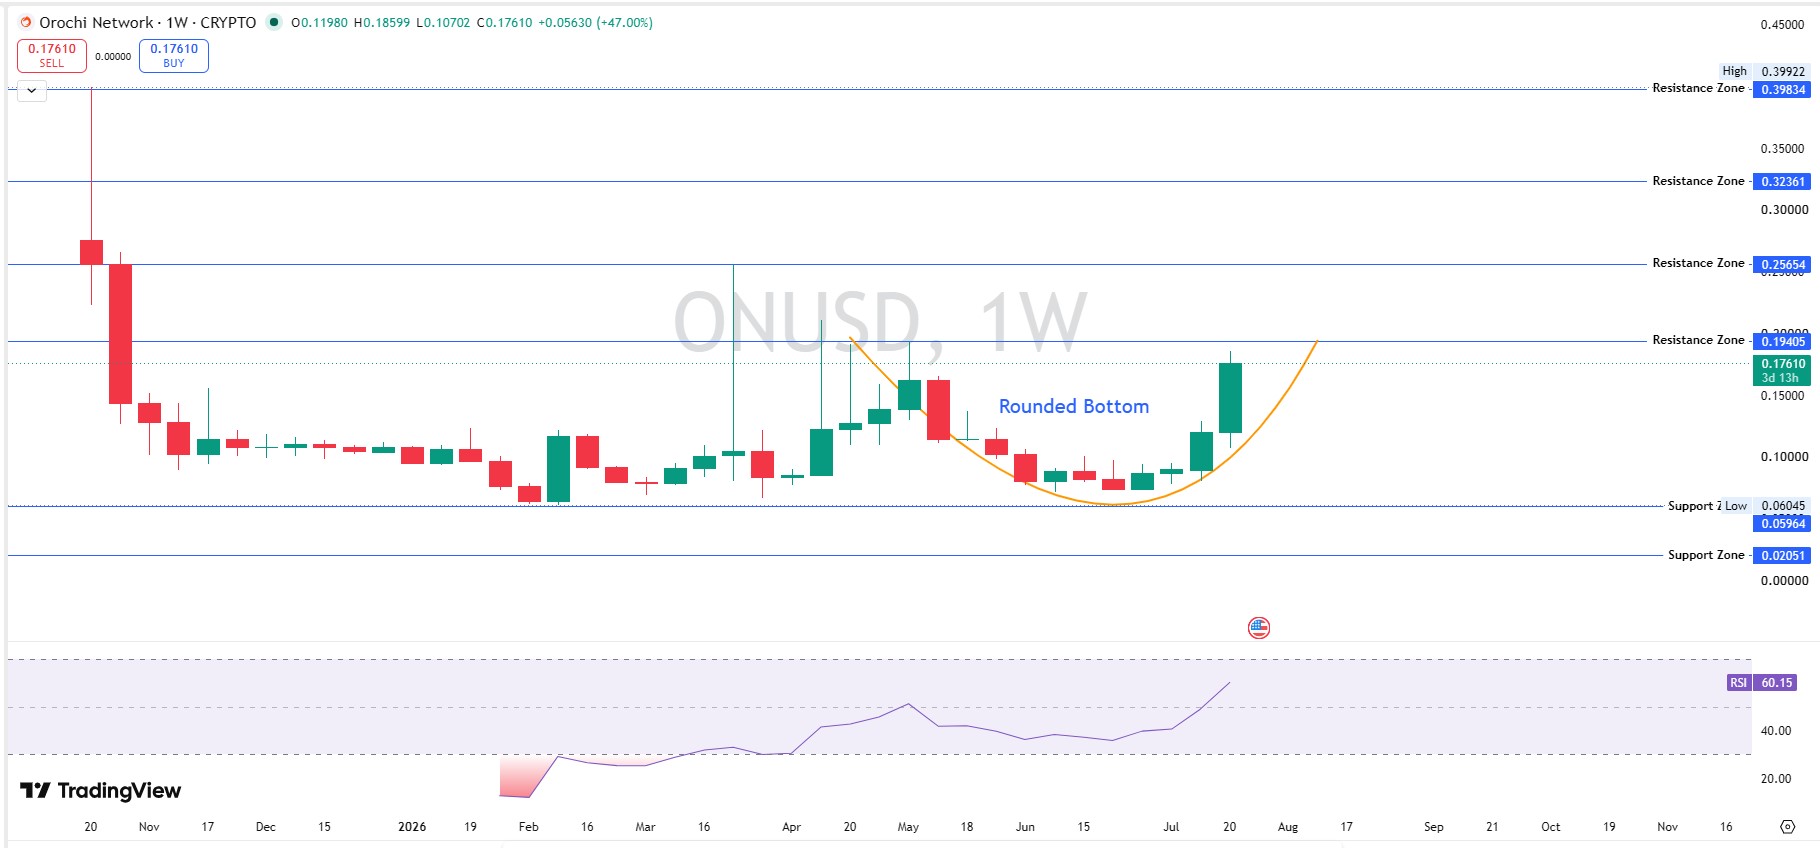
ON has been forming a rounded bottom since roughly February 2026, a pattern where price gradually curls upward instead of sharply reversing, visible clearly on theweekly TradingView chart. It's a slower, more organic base than a V-shaped bounce, and it often signals accumulation by patient buyers rather than a short squeeze.
This week's candle alone added 47%, closing at $0.1761 after opening at $0.1198.
That's a massive weekly range. But volume and RSI both support it. Weekly RSI sits at 60.15, climbing steadily from the mid-30s back in February. There's room left before this gets stretched.
Resistance zones stack up above: $0.1940, then $0.2565, then $0.3236, and finally $0.3983, which lines up with the token's all-time high from October 2025.
That all-time high sits 55% above the current price. A long way off, but not an unreasonable target if the rounded bottom thesis plays out over the coming months, especially with other2026 price forecasts across the sector leaning constructive.
On-Chain Data: Whale Concentration Risk
Here's where the bullish story gets a reality check.
Orochi Network's holder base is extremely concentrated.Etherscan's token page shows 667 total token holders, and on-chain analytics put the Gini distribution score at 0.9884, essentially the highest concentration reading possible on a scale that runs to 1.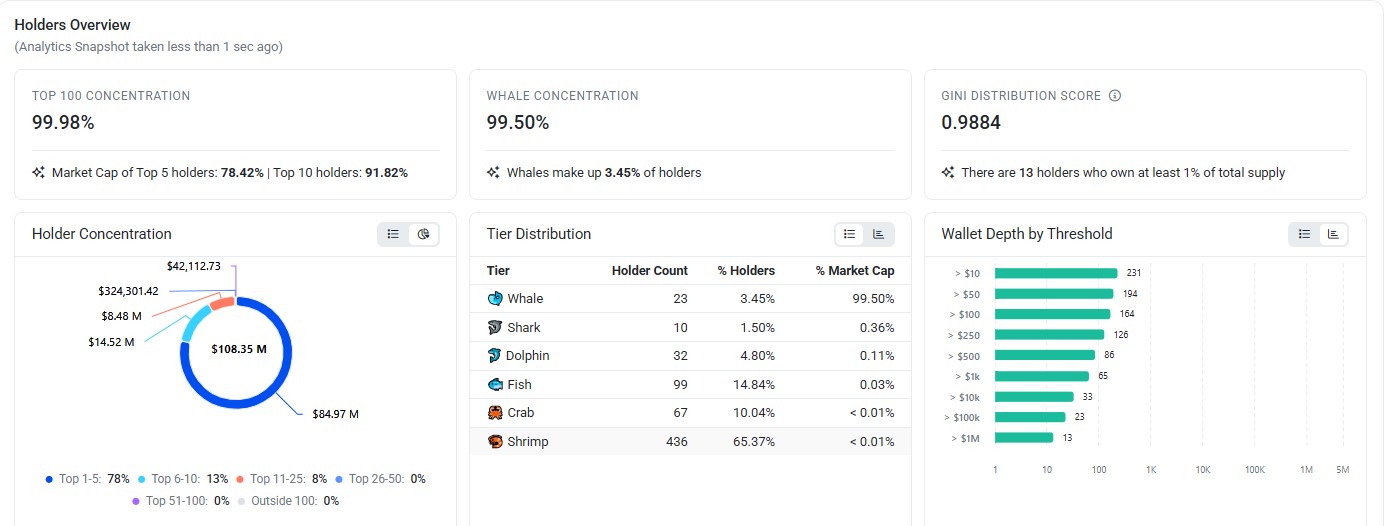
Top 100 wallets hold 99.98% of supply. Whale wallets alone, defined here as the top concentration tier, make up 3.45% of holders but control 99.50% of market cap value.
Breaking it down further: the top 5 wallets alone hold 78% of total supply. The top 10 combined hold 91.82%.
Wallet number one holds 134.75 million tokens, worth about $23.78 million at the current price, roughly 22.46% of the entire supply in a single address. Wallet number two holds another 16.67%. Wallet number nine is labeled as a Gate Exchange deposit address, holding 2.36%.
We should be direct about what this means. A handful of wallets can move this market with a single transaction, a dynamic worth watching againstwhale accumulation patterns seen elsewhere in the market. That's not a minor footnote; it's the single biggest structural risk in this setup.
Derivatives and Liquidation Data
Liquidation data over the past 24 hours tells a lopsided story.
$498.06K in total positions got liquidated in the last day, according toCoinGlass liquidation data. Of that, $306.86K came from short positions, against $191.20K in longs.
Shorts are getting squeezed. Hard.
Zoom into the 12-hour window, and the pattern holds: $253.16K in short liquidations against $164.01K in longs. Even the most recent hour shows shorts taking the bigger hit, $15.95K wiped out versus just $1.09K on the long side.
This confirms what the price chart already suggested. Traders betting against this move got caught offside, and their forced buybacks likely added extra fuel to the rally, echoing the kind ofcapital rotation between assets seen when a sector narrative heats up.
Exchange Volume and Liquidity
Binance dominates ON's futures volume by a wide margin, handling $92.18 million against BingX's $9.07 million, Bitunix's $5.33 million, MEXC's $5.20 million, Bybit's $3.17 million, and smaller amounts on Gate and KuCoin.
That concentration on a single exchange isn't unusual for a token this size, but it does mean Binance order book conditions will likely dictate short-term volatility more than any other venue.
Liquidity-to-market cap sits at 4.02%, on the thinner side, perCoinMarketCap's live market data. Worth watching if volume cools off.
Tokenomics and Supply
ON has a circulating supply of 144.27 million tokens against a total supply of 700 million and a max supply of 1 billion, perCoinMarketCap's supply metrics. Fully diluted valuation (FDV, what the market cap would be if every token that will ever exist were already circulating) sits at $176.58 million, roughly seven times the current market cap.
That gap matters. As more tokens unlock and enter circulation, sell pressure risk grows unless demand keeps pace.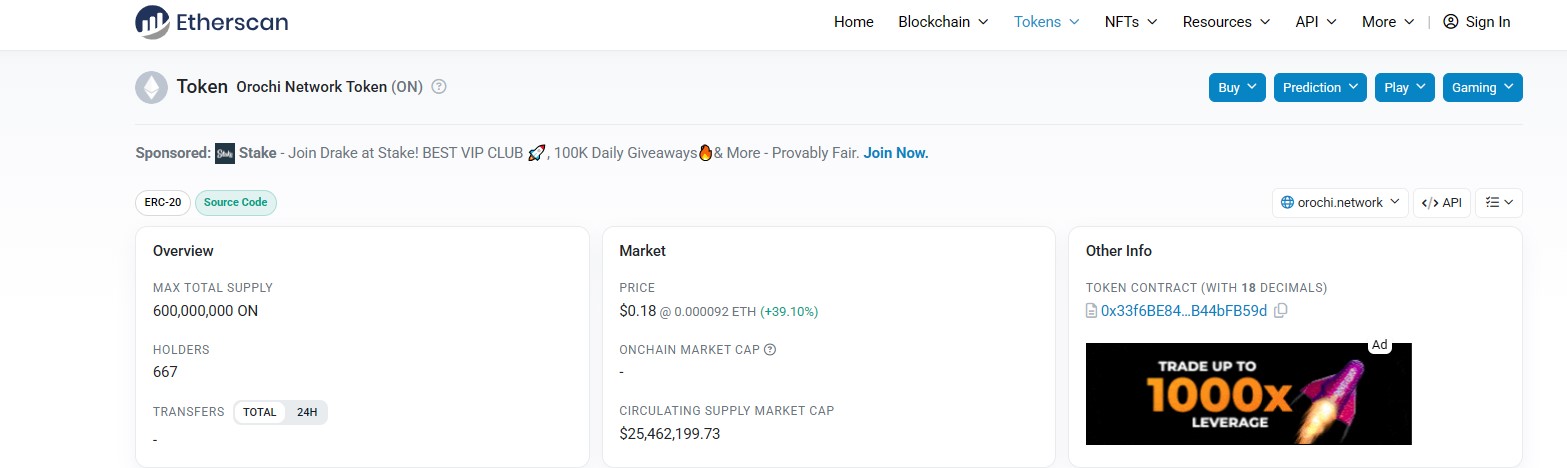
The token contract is verified onEtherscan's contract page at 0x33f6BE84becfF45ea6aA2952d7eF890B44bFB59d, carrying a CertiK rating of 4.6 out of 5.
Price Prediction Table: Bull, Base, and Bear Case
Scenario
Timeframe
Target
Probability
Invalidation Level
Bull
7 to 30 days
$0.2565 to $0.3236
35%
Daily close below $0.1450
Base
24 to 96 hours
$0.1650 to $0.1940
45%
Loss of $0.1450 channel support
Bear
7 to 14 days
$0.1120 to $0.1300
20%
N/A, this is the downside case itself
Every target here comes with a probability and an invalidation point on purpose. None of this is a guarantee; it's a framework for how the setup could unfold.
Long-Term Outlook Into 2026
If the rounded bottom pattern keeps developing the way it has since February, the path of least resistance stays upward through the rest of 2026, with the $0.2565 and $0.3236 zones acting as the next real tests.
A retest of the October 2025 all-time high near $0.3963 isn't off the table if momentum holds and broader crypto market conditions stay supportive, a dynamic worth tracking against otherongoing price prediction coverage across the sector.
But that's a big if.
Whale concentration remains the wildcard that could undercut any long-term bull case at any point, regardless of what the chart shows.
Key Risks and Invalidation Levels
Extreme wallet concentration (top 5 holders control 78% of supply) creates dump risk that technical analysis alone cannot predict
FDV of $176.58 million against a $25.47 million market cap signals meaningful future unlock pressure
Liquidity-to-market-cap of 4.02% is thin enough that large orders can cause outsized price swings
A daily close below the $0.145 channel support would invalidate the near-term bullish structure
A sustained move below $0.112 would break the broader weekly uptrend and open a path back toward $0.06, a scenario comparable to the sharp reversals seen inprior resistance rejections across other altcoins
Glossary
RSI (Relative Strength Index): A momentum indicator from 0 to 100. Above 70 often signals overbought; below 30 often signals oversold.
EMA (Exponential Moving Average):A moving average that weights recent prices more heavily, reacting faster to new price action than a simple average.
FDV (Fully Diluted Valuation):The theoretical market cap if all tokens that will ever exist, including unminted or locked ones, were already in circulation.
Liquidation:The forced closing of a margined trading position when losses erode the trader's collateral below a required threshold.
Gini Score:A statistical measure of distribution inequality, adapted here to measure how concentrated token ownership is among wallets. Closer to 1 means more concentrated.
Invalidation Level: The specific price point at which a trading thesis is considered wrong and no longer valid.
Disclaimer: This article is for informational purposes only and does not constitute financial advice. Cryptocurrency markets are highly volatile. Always do your own research before making investment decisions.