Pudgy Penguins (PENGU) is hovering near $0.0064. The chart shows the early stage of an uptrend. Pudgy Penguins (PENGU) is battling to move in any direction within the extreme fear market. Bul
- Pudgy Penguins (PENGU) is hovering near $0.0064.
- The chart shows the early stage of an uptrend.
Pudgy Penguins (PENGU) is battling to move in any direction within the extreme fear market. Bulls are attempting to flip the asset’s momentum green. Moreover, the technical structure is leaning bullish, and the short-term price movement shows a positive trend to set in the PENGU market.
If the buyers firmly work on the ground, the momentum stays green. Significantly, Pudgy Penguins is currently trading at around the $0.006448 range, with a 4.84% rise in value over the last 24 hours. The current price is holding above the daily low at $0.006084, with the highest trading level noted at $0.006451.
Pudgy Penguins’ price structure depends on its upcoming ranges, and the initial resistance level might be positioned at $0.006490. The price action would climb higher with the assistance of bulls to the $0.006548 level. A stronger move above $0.0066 confirms that buyers are in control, gradually aiming higher targets.
On the flip side, the immediate support after the bears re-enter the PENGU market would be at $0.006401. The price momentum may follow the downside correction and hit a low of $0.006358. A deeper plunge toward or below $0.0062 is crucial for the token’s trajectory, where it may continue to retrace or stall.
Is Pudgy Penguins Heading Toward the Green Side?
The four-hour technical chart of PENGU reveals that the MACD is above the zero line while the signal line is just below the zero line. It hints that the bullish momentum is starting to strengthen. The short-term trend has turned positive, and the broader momentum is still catching up.
This setup often reflects an early stage of a bullish trend, with buyers gradually gaining control if the asset’s momentum continues to improve.
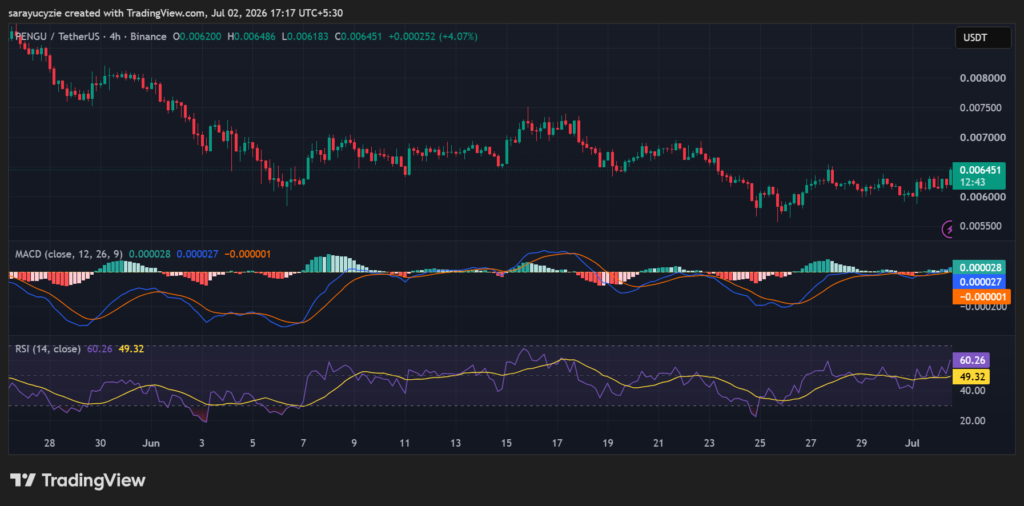 (Source: TradingView)
Furthermore, Pudgy Penguins’ daily Relative Strength Index (RSI) is stationed at the 60.26 level, and it exhibits a healthy bullish momentum. The value is comfortably staying above the neutral level, with the buyers currently having the upper hand.
At the same time, it also remains below the 70 overbought threshold, suggesting there is still room for more upside before the market becomes overstretched. This supports a positive price outlook, provided buying momentum continues to hold.
Crypto Market Highlights
Ethereum (ETH) Bears Pressure the $1,100 Support: Can Buyers Defend It?