Shiba Inu is buzzing again after a viral post claimed altcoin season is about to explode, with SHIB singled out for an "awakening." The chart tells its own story too: price recently faked out
Shiba Inu is buzzing again after a viral post claimed altcoin season is about to explode, with SHIB singled out for an "awakening."
The chart tells its own story too: price recently faked out of a long-term falling channel before snapping back down, and now it's sitting right on a support level that could decide the next big move.
This Shiba Inu Price Prediction breaks down whether that support holds, whether the altseason hype has any technical backing, and what the key levels through 2030 could look like.
Market data was checked on August 19, 2026, at 11:55 IST.
What is the SHIB price today?
Metric
Value
Price
$0.000004470
24h Change
+1.86%
Market Cap
$2.62B
FDV
$2.62B
24h Volume
$48.01M
Vol/Mkt Cap (24h)
1.83%
Liq/Mkt Cap
0.15%
Total Supply
589.49T SHIB
Max Supply
589.55T SHIB
Circulating Supply
589.23T SHIB
Holders
3.07M
Source: Data from CoinMarketCap as of August 19, 2026, at 11:55 IST. Figures may vary slightly across other tracking websites.
A post from Whale News Daily on X claims Shiba Inu is about to trigger altcoin season, calling the move an "awakening" and pointing to a monthly OTHERS/BTC chart showing a projected breakout of over 300% from a multi-year descending pattern. 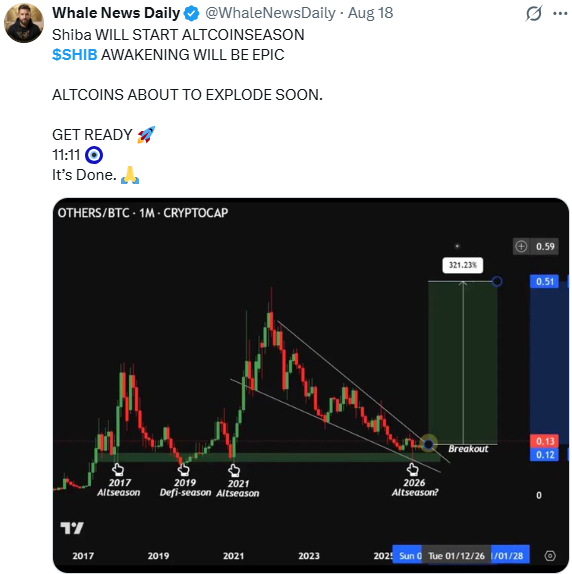
Source: Data From X
Note: CoinGabbar could not independently verify this claim, and it's not backed by any on-chain data specific to SHIB.
This is a broad market-cycle call about altcoins in general, not a SHIB-specific signal, so it should be treated as speculation rather than a confirmed trend.
Shiba Inu Price Prediction Chart: Technical Analysis
Pair: SHIB/USDT · Market: Spot (Crypto) · Exchange: KuCoin · Timeframe: 1D · Source: TradingView · Timestamp: August 19, 2026, 11:55 UTC+5:30
SHIB has been trading inside a long-term descending channel since mid-2024, making lower highs and lower lows across that structure.
In May 2026, the price pushed toward the $0.000006604 zone in what looked like a channel breakout, but the move failed and rolled back over, marked on the chart as a fake breakout or buyer's trap.
Price slid back toward the channel floor through June and early July, then broke above the channel's upper trendline in late July with a sharp move toward the $0.000005313 zone.
That breakout hasn't been confirmed yet since the price has since pulled back and is now consolidating near $0.000004470, just above the old channel boundary.
The EMA cluster sits close by, with the 20-period EMA near $0.000004545 and the 50-period EMA near $0.000004800, both still acting as resistance until reclaimed.
SHIB's daily RSI sits at 46.44, right around neutral.
The $0.000004363 and $0.000004072 levels now act as a test of the broken trendline. Holding above them keeps the late-July breakout intact, while losing them drags the price back inside the old descending channel.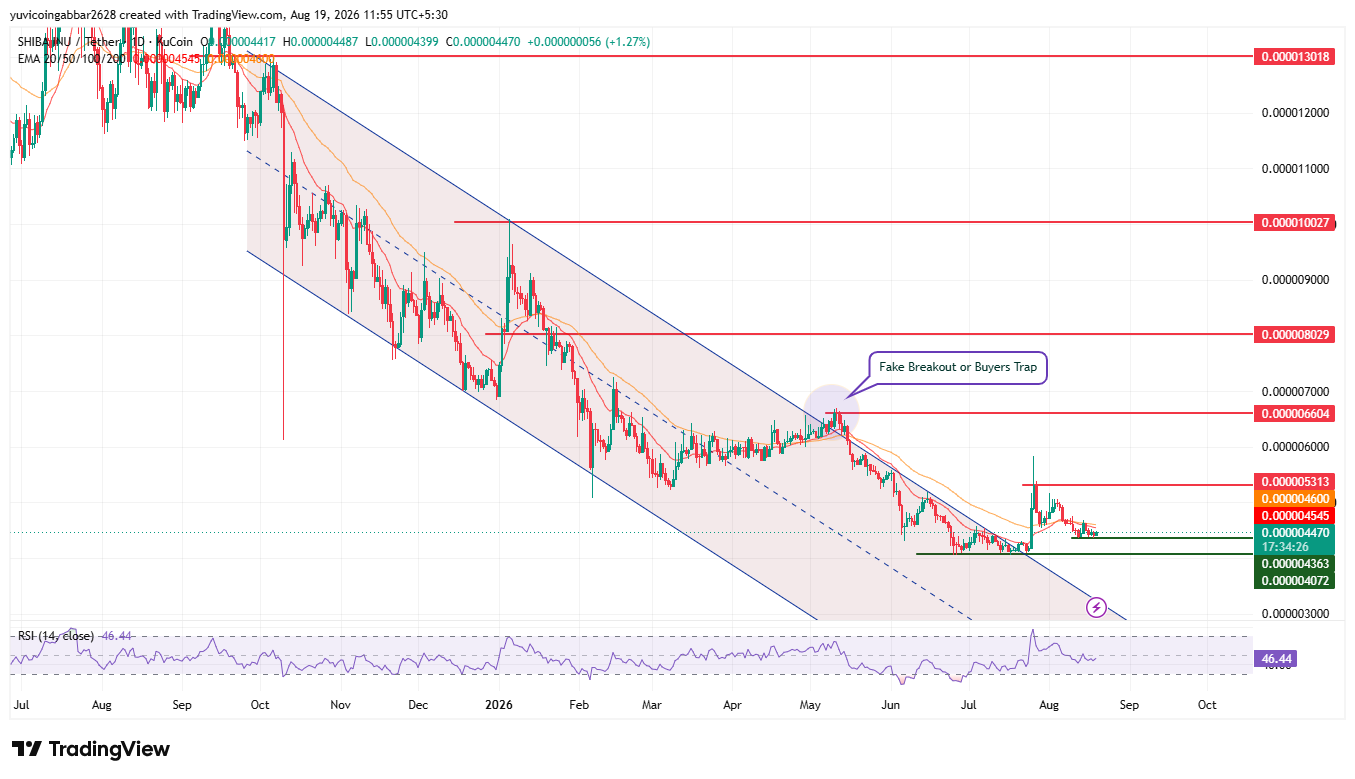
Shiba Inu Key Price Levels Before the Next Big Move
Level Type
Price
Resistance 4
$0.000013018
Resistance 3
$0.000010027
Resistance 2
$0.000008029
Resistance 1 (fake breakout zone)
$0.000006604
Nearest Resistance
$0.000005313
Immediate Price Reference
$0.000004470
First Support
$0.000004363
Deeper Support
$0.000004072
EMA Levels
EMA
Price
EMA 20
$0.000004545
EMA 50
$0.000004800
Shiba Inu Forecast 2026: Bull Case vs Bear Case
SHIB price target 2026 Bull case: Holding above $0.000004363 and reclaiming the EMA cluster near $0.000004545 to $0.000004800 would confirm the late-July breakout is holding rather than fading.
A close above $0.000005313 would open the path toward the $0.000006604 zone that rejected price in May, and this time a real break above it would matter.
SHIB price target 2026 Bear case: A drop below $0.000004363 would put the breakout in doubt and risk a slide back toward $0.000004072, effectively pulling the price back inside the old channel.
Losing that level would echo the May rejection, just from the other side of the structure.
SHIB Price Scenarios 2026: Triggers and Invalidation
Scenario
Trigger
Likely Outcome
Invalidation Point
Breakout hold / bullish
Reclaim EMA cluster near $0.000004545–$0.000004800
Move toward $0.000005313, then retest $0.000006604
Rejection below $0.000004363
Range consolidation
Price stays between $0.000004363 and $0.000005313
Sideways chop before the next move
Break of either boundary
Channel re-entry / bearish
Close below $0.000004363
Slide back inside the channel toward $0.000004072
Reclaim of $0.000004363
Shiba Inu Price Prediction 2026
SHIB's path now depends on whether the late-July breakout above the channel holds.
If $0.000004363 holds as support, a move back toward the EMA cluster and the $0.000005313 to $0.000006604 zone is realistic, this time from outside the old channel structure.
A break below shifts focus back to $0.000004072 and a return inside the channel.
Scenario
2026 Target Range
Bearish (breakout fails)
$0.0000030 to $0.0000044
Base case (range-bound)
$0.0000044 to $0.0000053
Bullish (breakout holds)
$0.0000053 to $0.0000066
Shiba Inu Price Prediction 2027
The key level to watch is still $0.000006604, the zone that rejected SHIB in May. A confirmed close above it would mark a genuine structural shift.
Scenario
2027 Target Range
Bearish
$0.0000035 to $0.0000066
Bullish
$0.0000066 to $0.0000100
Shiba Inu Price Prediction 2028
Scenario
2028 Target Range (speculative)
Bearish
$0.0000040 to $0.0000070
Bullish
$0.0000070 to $0.0000130
Shiba Inu Price Prediction 2029
Scenario
2029 Target Range (speculative)
Bearish
$0.0000035 to $0.0000090
Bullish
$0.0000090 and above
Shiba Inu Price Prediction 2030
Scenario
2030 Target Range (speculative)
Bearish
$0.0000025 to $0.0000045
Bullish
$0.0000090 to $0.0000200
Shiba Inu Price Prediction: Expert View
According to CoinGabbar analysts, the failed breakout in May is the key data point here: SHIB tried to escape its multi-year channel and got rejected hard, which is exactly the kind of setup that needs to be respected rather than dismissed.
RSI at 46.44 shows no strong bias either way right now, and the price sitting on support with the EMAs still overhead suggests this is a wait-and-see zone.
The altseason tweet adds noise but no SHIB-specific confirmation.
The $0.000004363 level is the one to watch holding it keeps a recovery attempt alive, while losing it plays right back into the bearish channel structure.
Disclaimer: This piece is for informational purposes only and isn't financial advice. The levels and scenarios above are based on technical chart analysis and publicly available data at the time of writing, and crypto markets can move sharply within hours, so past patterns don't guarantee future outcomes. Long-term scenarios, especially 2028 through 2030, are speculative and not based on confirmed data. It's worth doing independent research and considering your own risk tolerance before acting on any of the levels discussed here.