This Shiba Inu price prediction looks at where $SHIB stands after a volatile week that has traders watching closely for the next move. Shiba Inu launched in 2020 as a decentralized meme token
This Shiba Inu price prediction looks at where $SHIB stands after a volatile week that has traders watching closely for the next move.
Shiba Inu launched in 2020 as a decentralized meme token and has since grown into one of the most widely held assets in the market, backed by the Shibarium layer-2 network.
The Shiba Inu price today is $0.00000536 at the moment, down 2.2% over the last 24 hours, with a market cap of $3.162B and a 24-hour trading volume of $71.253M.
Live Market Data
Metric
Value
Price
$0.00000536
Market Cap
$3.162B
Fully Diluted Valuation
$3.163B
24-Hour Trading Volume
$71.253M
Circulating Supply
589.239T
Total Supply
589.496T
Source: SHIB market data taken from CoinGecko, as of Sep 8, 2026. Figures may vary slightly across other tracking websites.
Exchange Volume
Shiba Inu Coin futures activity right now isn't parked on one or two exchanges; it's scattered fairly wide.
LBank tops the list with $15.76M in 24-hour volume, and OKX sits just behind at $12.99M. 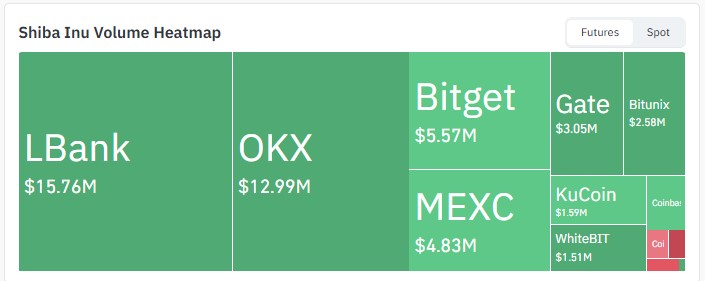
Source: Volume Heatmap Data Taken From CoinGlass , As of Sept 8, 2026
Bitget and MEXC aren't far off either, pulling in $5.57M and $4.83M, while Gate and Bitunix add a combined $5.63M between them.
There's also a trickle coming through KuCoin, WhiteBIT, and Coinbase, which rounds things out but doesn't change the overall picture much: for a token this size, the volume here is honestly on the thinner side.
Shibarium Holder Concentration
Look at who actually owns $SHIB, and the picture gets lopsided fast. Just the top 100 wallets sit on 82.76% of everything in circulation.
Whales make up barely 0.05% of holders, yet somehow they're holding 94.72% of total market cap between them.
Only seven wallets individually cross the 1% threshold, and the Gini score, sitting at 0.9958, pretty much confirms what those numbers already suggest: ownership here is about as uneven as it gets.
Tier
Holder Count
% of Holders
% of Market Cap
Whale
823
0.05%
94.72%
Shark
3,757
0.22%
1.80%
Dolphin
36,897
2.19%
1.87%
Fish
214,311
12.69%
1.24%
Crab
501,049
29.68%
0.34%
Shrimp
931,389
55.17%
0.04%
Source: Holder Data Taken From Etherscan, As of Sept 8, 2026
This kind of concentration means large wallet movements can meaningfully sway price, which is a factor worth weighing alongside any technical breakout or breakdown signal discussed below.
Shiba Inu Coin News
SHIB Gains Ground in Japan
Among this week's shiba inu coin news, outlet U.Today reported that SHIB has cleared a notable regulatory hurdle in Japan, describing it as a milestone that opens access to a major new market.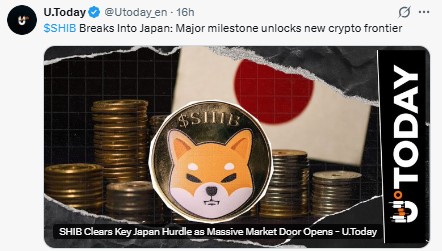
Source: Data Taken From @Utoday_en, X Account, As of Sept 8, 2026
The report frames this as part of a broader shift in how Japan treats crypto assets, giving $SHIB a stronger regulated footing among licensed exchanges there.
It's a longer-term positive for Shiba Inu price today sentiment, even though it isn't the kind of catalyst that moves price within hours.
Shiba Inu Price Prediction: Technical Outlook
On the 4-hour SHIB/USDT chart on Binance, the price has been climbing inside an ascending channel through late August and early September.
The candle currently in progress is testing the channel's lower boundary, but that breakdown isn't confirmed yet; it only becomes valid once this candle closes below the boundary. 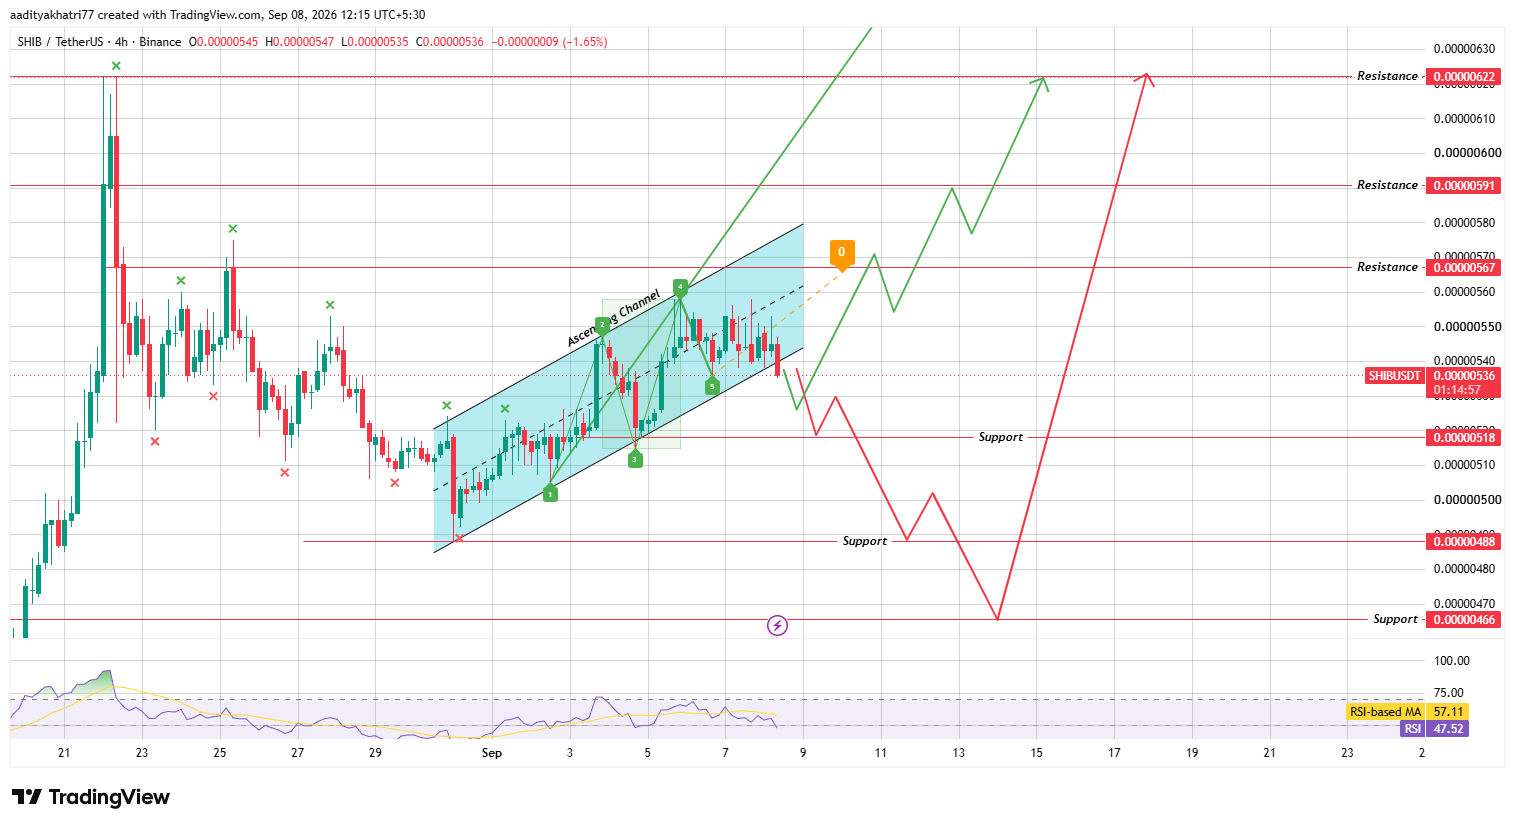
Source: Chart Taken From TradingView, as of Sep 8, 2026
Until then, there's a real chance this is a fake breakdown or a liquidity sweep designed to trigger stop-losses before the price reverses higher.
RSI has eased to 47.52, below its moving average of 57.11, showing momentum has cooled from the recent highs.
A wolfe wave structure on the chart projects an upside target near the $0.00000622 resistance zone, which keeps the broader setup leaning constructive.
Could $SHIB Bounce and Push Toward Resistance?
If the current candle closes back inside the channel and price holds support with rising volume, $SHIB could work its way back up toward $0.00000567 first.
Clearing that zone opens the path to $0.00000591, and a stronger push could extend all the way to the Wolfe wave target near $0.00000622.
What If The Breakdown Candle Closes Confirmed?
If instead this candle closes firmly below the channel's lower boundary, $0.00000518 becomes the first support level to watch.
Should selling continue past that, $0.00000488 and then $0.00000466 come into view, which would mark a genuine breakdown rather than a shakeout.
Support and Resistance Levels
Support
Resistance
$0.00000518
$0.00000567
$0.00000488
$0.00000591
$0.00000466
$0.00000622
Bull, Base, and Bear Scenarios
Scenario
Setup
Level
Bull
The candle closes inside the channel, and the support holds with volume.
$0.00000567–$0.00000622
Base
Price consolidates near current levels; breakdown is unconfirmed.
$0.00000518–$0.00000567
Bear
Candle closes with a confirmed break below channel support
$0.00000518–$0.00000466
Glossary
Picture two upward-sloping lines running side by side, with price weaving between them as it climbs; that's an ascending channel in a nutshell.
A fake breakdown happens when price briefly dips below a support line without enough follow-through to hold there, often snapping right back once the move fails to attract real selling.
Liquidity sweepdescribes something similar from a different angle: price pokes past an obvious level just long enough to trigger stop orders sitting nearby, then reverses once those orders have been absorbed.
Thewolfe wave, meanwhile, is built from five connected swing points and gets used to project where price might head once that structure plays out.
RSI simply tracks how fast and how far price has moved lately, which is why it's useful for spotting when momentum is fading before the price chart itself shows it.
Shiba Inu Coin vs Bitcoin
SHIB's price behavior continues to lean heavily on overall market direction, and Bitcoin price today plays a large role in that.
When bitcoin price prediction sentiment turns cautious, thinner-liquidity tokens like $SHIB tend to see sharper swings on both sides of any support or resistance test, which is part of why this week's channel setup carries extra uncertainty.
Methodology
This Shiba Inu price prediction is based on 4-hour candlestick data from Binance, RSI readings, and the ascending channel and wolfe wave structures visible since late August 2026.
The scenario levels above depend on how the current candle closes and are not guaranteed outcomes.
Readers following shiba inu news should treat this as a technical framework rather than a fixed forecast.
Expert Opinion
Market commentators tracking this setup note that an unconfirmed breakdown candle inside a longer uptrend often resolves as a shakeout rather than a genuine trend change, especially when RSI hasn't broken down sharply.
Their view is that Japan's regulatory progress adds a supportive backdrop for SHIB longer term, but the next few candles on the 4-hour chart will likely matter more for price in the immediate term.
Disclaimer: This Shiba Inu Price Prediction is for informational purposes only and should not be treated as financial advice. Cryptocurrency markets are highly volatile, technical patterns can fail to play out as expected, and any of the scenarios described above carry a realistic probability of not occurring. Readers should conduct independent research before making any investment decisions.