Here's What the On-Chain Data Says Before You Believe It SIREN is up roughly 9–10% today, trading in the $0.08492–$0.08777 range depending on the aggregator, its sharpest single-day green can
Here's What the On-Chain Data Says Before You Believe It
SIREN is up roughly 9–10% today, trading in the $0.08492–$0.08777 range depending on the aggregator, its sharpest single-day green candle since the failed bounce earlier this month.
On the surface, that reads like a script change after weeks of lower highs and lower lows.
Underneath it, the same structural fact that has overridden every technical signal on this token since February hasn't moved: on-chain trackers still show roughly 595.7 million SIREN, well over 80% of circulating supply, sitting with wallets tied to a single controlling cluster whose average accumulation price sits near $0.045.
That cluster has run this exact pattern four separate times: quiet accumulation, a viral pump, a 90%+ distribution crash, then fresh wallets reaccumulating at the bottom to reset for the next cycle.
The honest question isn't whether SIREN is up today; it clearly is. It's whether today's move has the one thing every prior fake-out lacked: sustained volume without a matching outflow from the whale cluster to exchange wallets. That single data point, not the percentage move, is what actually tells you if the script changed.
The Insider Data: What the On-Chain Tripwire Actually Is
On-chain researchers tracking SIREN since February have converged on one specific signal worth watching above everything else: whether the whale cluster's roughly 595.7 million tokens start moving out to known Binance, Bybit, or Bitget proxy wallets in large batches.
Historically, that exact movement has preceded 60–80% drawdowns within 48 hours in this token's trading history.
As of the most recent on-chain reads referenced by analysts covering SIREN this week, no large-scale outbound transfer from the core cluster to exchange wallets has been confirmed yet, which is the one genuinely encouraging data point behind today's move.
The second insider detail worth knowing: the controlling cluster's average buy price sits near $0.045.
A controlling entity sitting near its own cost basis has far less urgency to dump than one facing a loss, which is a mildly constructive read, but it's also exactly the kind of comfortable position from which a fifth accumulation-then-pump cycle could just as easily be staged.
The Four-Cycle Pattern, For Anyone New to This Token
● Cycle mechanics, documented since February: quiet accumulation at distressed prices, a viral push using the AI-agent narrative and leveraged futures interest, a distribution event that crashes the token 90% or more; and then a reset using freshly funded wallets to buy the dumped supply back at a fraction of the exit price.
● June 13–15 collapse: the cluster sold roughly 670 million tokens, about 92% of circulating supply at the time, for $64.8 million, in a 48-hour window, crashing SIREN from $1.30 to $0.05.
● June 19 bounce: SIREN rocketed roughly 150% in 24 hours to near $0.11, a move multiple analysts flagged at the time as short covering and momentum trading rather than organic recovery.
● Early July: that bounce faded. SIREN slipped back below the $0.095–$0.105 zone and, per CoinGabbar's own July 9 coverage, $0.032 was flagged as the line between stabilization and a fresh leg down.
● July 11 (today): the roughly 9–10% move under discussion here, the question this article exists to answer.
What Would Actually Make Today Different
Recent coverage of this token laid out the mechanical pattern in plain terms: every bounce since the March all-time high has followed the same architecture, spiking in price on comparatively low volume as short positions get squeezed.
Then sellers, whether residual whale supply or retail holders trying to exit into strength, push it back down.
Nothing about today's price action alone tells you which pattern this is.
What would tell you: whether trading volume stays elevated for multiple sessions rather than fading within hours, and whether the whale cluster's wallets stay put rather than routing tokens toward exchange deposit addresses.
Blockchain investigator publicly referenced meme tokens with heavily insider-controlled supply on July 6.
questioning inflated valuations built on concentrated ownership, a comment widely read as applying directly to SIREN given the timing and the token's documented ownership structure.
That kind of continued outside scrutiny is itself a data point: the market hasn't forgotten the concentration story just because the candle is green today.
Technical Analysis 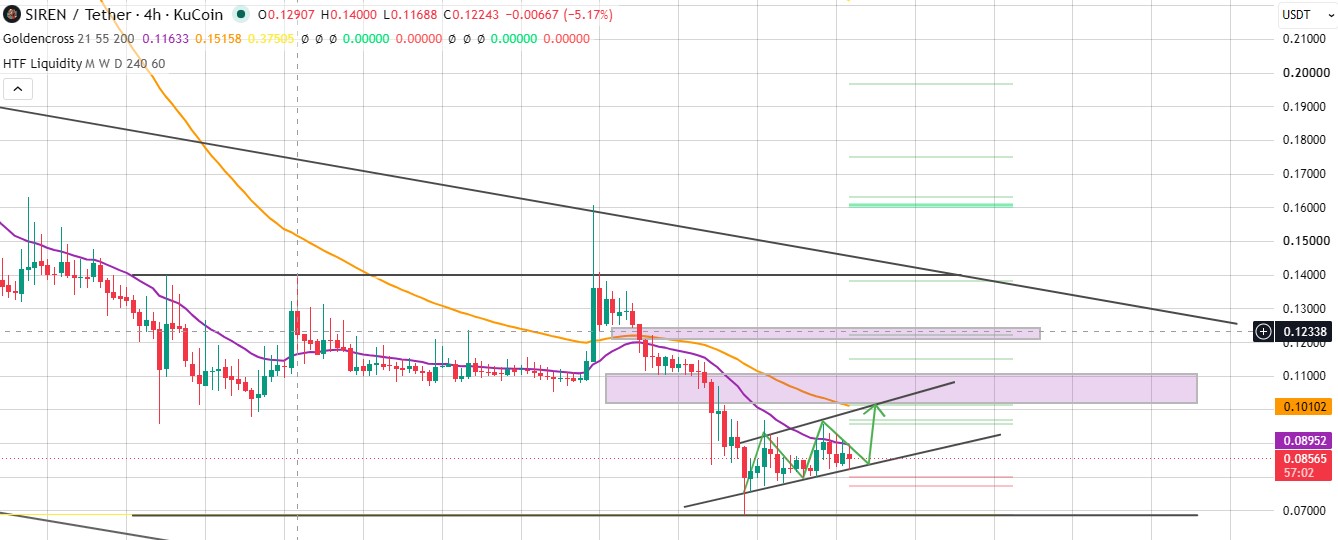
Indicator
Current Reading
Signal
24h price change
Approximately +9–10%
Sharpest single-day gain since the failed early-July bounce
Key support
$0.080 (per recent coverage), then the $0.0635 all-time low
Loss of $0.032 would reopen a retest of the ATL
Key resistance
$0.089, then $0.095–$0.105, the zone lost after the June 19 bounce
Multiple layers to reclaim before today's move looks structural
Moving averages (50/100/200 EMA)
Price remains below all three on most trackers
Broader trend still technically bearish despite today's bounce
Volume
Elevated today; needs to persist beyond 24 hours to be meaningful
The single most important confirmation signal right now
SIREN Price Prediction: Bear, Base, Bull, and Extreme Bull Scenarios
Every scenario here is explicitly conditioned on whale cluster behavior, because that variable has overridden technical structure in every prior SIREN cycle this year.
Scenario
Next 7 Days
End of 2026
Key Condition
Bear Case
$0.055–$0.065
$0.03–$0.05
Today's spike fades within days; whale cluster begins routing tokens to exchange wallets, signaling cycle five distribution
Base Case
$0.060–$0.070
$0.05–$0.08
Move partially holds but stalls below $0.065; no confirmed whale exit, but no confirmed reduction in concentration either
Bull Case
$0.075–$0.10
$0.09–$0.14
Volume stays elevated multiple sessions, $0.095–$0.105 zone reclaimed and held
Extreme Bull
$0.11+
$0.15–$0.25
Verified, independent evidence the whale cluster's concentration is genuinely declining, sustained organic volume unrelated to the cluster's own wallets
Risk & Opportunity
Risks
Opportunities
Whale cluster still holds well over 80% of supply; nothing about today's move changes that structural fact
Whale's $0.045 average cost basis means less urgency to dump at current prices than during past deep-loss periods
Four prior pump-and-dump cycles all began with a move that looked exactly like today's
No confirmed large-scale outbound transfer to exchange wallets has been flagged as of writing, the key bullish absence
ZachXBT's July 6 comments on insider-controlled valuations keep external scrutiny active and unresolved
SirenAIAgent and SIREN Dex retain genuine BNB Chain Foundation incentive backing independent of price action
Cross-source price data disagreement ($0.062 to $0.077 range) signals thin, fragmented liquidity
A volume-confirmed, multi-session hold above $0.085 would be the first genuinely new data point since June 19
YMYL Disclaimer: This article covers cryptocurrency, a Your Money or Your Life (YMYL) subject. It is for informational purposes only and does not constitute financial, investment, or legal advice. SIREN's documented history of extreme, whale-driven volatility and concentrated ownership makes it exceptionally high-risk, including the possibility of rapid, near-total loss of value. Prices and on-chain data referenced here reflect publicly available information as of July 11, 2026, and may change without notice, including within the same trading day. Always conduct independent research and consult a licensed financial advisor before making investment decisions.