

Markets8 min read
Why Bitcoin’s Order Book Can Fool You
The short version Depth shows quantity, not how fast it changes. Book Churn counts price-level updates every ten minutes. Volatility hit rate: 63% against a 50% baseline. A simple price-range
SUI became a trending coin on CoinGecko, and SuiWire saw a 4.02% increase in the ranking snapshot at capture. The token had a positive daily change even as both spot and futures trading volum

Sui market activity shows rising search visibility alongside weaker trading volumes and growing derivatives exposure, as the token records gains despite difficult market conditions.
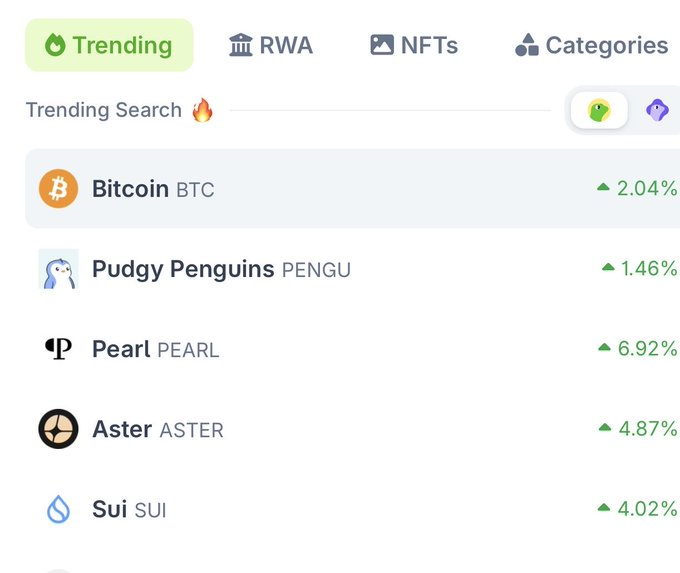
SuiWire reported that SUI entered CoinGecko’s top Trending Search list, posting a 4.02% gain. The post also directed readers toward ecosystem coverage and live market movements. In the displayed ranking, SUI appeared fifth, following Bitcoin, Pudgy Penguins, Pearl, and Aster.
 Source: X
Pearl recorded the largest listed increase at 6.92%, while Aster gained 4.87%. Bitcoin rose 2.04%, and Pudgy Penguins advanced 1.46%. SUI’s 4.02% reading placed it above the latter two assets.
The ranking provides a snapshot of search attention, rather than a measure of network usage. It does not conclude on the purpose of users' searches for the token or if interest will remain. Nor is there any indication in the image of how long SUI was in the trending results.
CoinGecko’s navigation also displayed separate sections for RWA, NFTs, and Categories. That layout places the trending list within a wider set of market topics. However, the supplied ranking contains no transaction, application, or developer figures.
The market dashboard listed SUI at $0.7208, up 1.11% over 24 hours. During that period, its low stood at $0.7073 and its high reached $0.7298. The displayed range therefore measured $0.0225 from low to high.
Market capitalization stood at $3.00 billion, against a fully diluted valuation of $7.21 billion. Circulating supply was listed at 4.14 billion tokens, out of 10 billion. The valuation gap reflects the difference between circulating tokens and maximum supply.
Spot volume reached $66.87 million, down 57.56% over 24 hours. Futures volume stood at $369.49 million, declining by 53.13%. Both markets recorded lower reported turnover despite the daily price increase.

Futures volume remained considerably higher than spot volume in the dashboard. The figures show derivatives activity outweighing spot trading during the measured period. They do not, on their own, establish the direction of future price movement.
Open interest grew by 0.96% to $404.46 million and the market-cap ratio was 13.49%. The rise coincided with a decrease in the volume of futures. The funding rate was at negative 0.0104% or minus 11.4% per year.
This is called negative funding rate, and meant that short sellers were paying long sellers. Liquidations reported totaled $305.42K, of which 55% were longs. These are the figures at a point in time for the dashboard reporting window.
Spot net inflows amounted to $2.6 million while futures net outflows were $755.6K. These are positive net moves in spot markets as well as futures withdrawals. The dashboard will not tell you who is using those flows.
The overall sentiment reading came in at a relatively low level, the Fear and Greed Index was at 11. That level was classified as Extreme Fear on the dashboard. SUI was also 86.5% off its record $5.352.
The immediate reference points were the $0.7073 daily low and $0.7298 high. A move beyond either level would extend the displayed trading range. The available figures offer a snapshot, not confirmation of a sustained trend.
The post Sui Market Activity Faces a Volume Slowdown appears on Coin Futura. Visit our website to read more interesting articles about cryptocurrency, blockchain technology, and digital assets.