Sui price prediction is worth a close look right now because two different stories are colliding at the same time: a rising trendline on the chart that has held up well and a stablecoin growt
Sui price prediction is worth a close look right now because two different stories are colliding at the same time: a rising trendline on the chart that has held up well and a stablecoin growth number that just posted one of its strongest weeks in a while. Here is the full picture.
Sui Price Today: Live Data and 24-Hour Change
SUI is currently trading around $0.7653, down 6.9% over the past 24 hours after losing close to $0.057 from its previous level.
Futures volume over the last day sits at $1.01 billion, well ahead of spot volume at $156.95 million, showing that leveraged traders are driving the bulk of today's movement.
Open interest stands at $657.51 million against a market cap of $3.13 billion. Circulating supply sits at 4.09 billion SUI out of a total and max supply of 10 billion tokens, meaning a little over 40% of SUI's eventual supply is currently in circulation.
Source: CoinGlass, September 10, 2026.
Sui News Today: Stablecoin Supply Ripping Higher
In Sui latest news, BSCN reported that Sui Network is becoming a genuine stablecoin heavyweight.
According to the report, Sui's stablecoin supply has jumped 13.2% in just the past week, pushing the total past $454 million.
That kind of one-week jump is not small, and it puts SUI at the 18th largest stablecoin blockchain in the world, ahead of ecosystems like Tempo and NEAR Protocol and Polkadot.
Stablecoin supply growth is often watched as a proxy for real on-chain activity and liquidity flowing into a network, so for anyone doing Sui trend analysis, this kind of jump suggests the ecosystem is attracting genuine usage rather than just speculative price interest.
Source: BSCN (@BSCNews) on X.
Quick Take
CMP: $0.7653 (chart-marked live price)
4-hour trigger level: break and close above $0.8442 opens the path toward $0.9554 and $1.1671
Failure level: break and close below $0.6970 shifts the structure bearish toward $0.6358
Data and chart timestamp: September 10, 2026, 4-hour Bybit perpetual chart
Risk note: SUI is sitting right on its ascending trendline at the moment, so this is a level where the next few candles could decide direction fast
Sui Technical Forecast September 2026
On the 4-hour Bybit perpetual chart, SUI has been climbing steadily along an ascending trendline since early September, and price has now come right back down to touch that same line.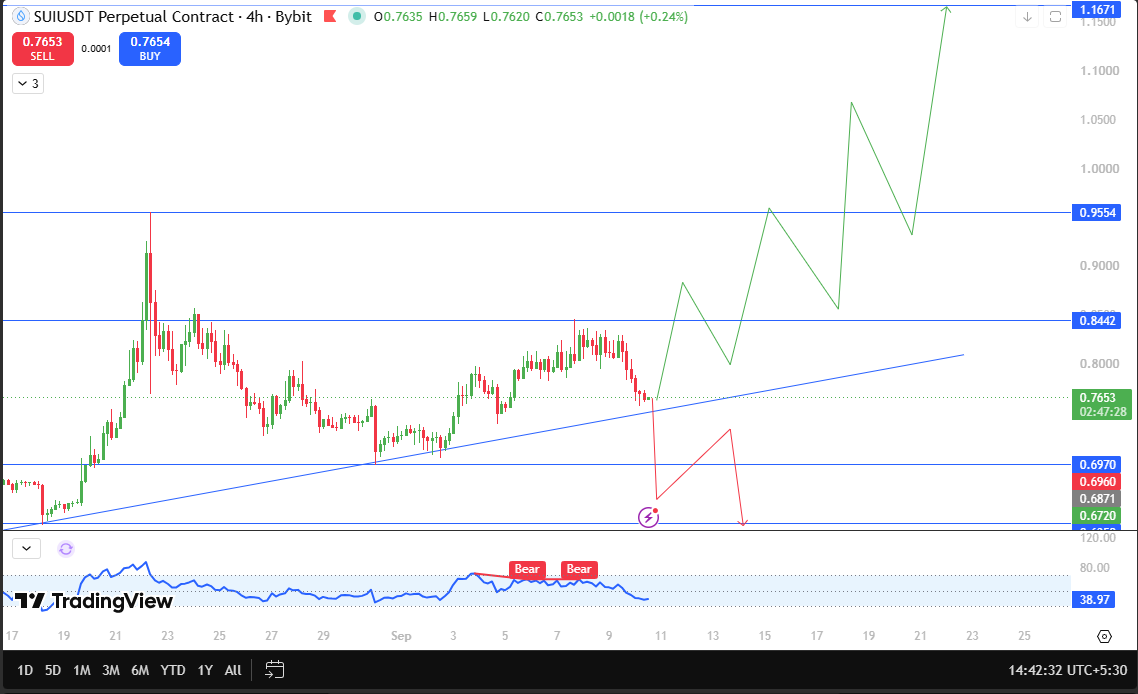
This is the kind of moment where a chart either confirms its strength or starts to show cracks, and right now SUI looks to be holding its ground rather than breaking down.
If SUI takes support from this trendline and pushes through $0.8442, that would mark roughly 10.3% upside from the current price and would be the first real sign that buyers are back in control.
From there, the next resistance sits at $0.9554, close to 24.8% above where SUI trades today, and if the move keeps building momentum beyond that point, a much bigger target opens up at $1.1671, over 52% higher than current levels.
That kind of extended move would likely need more than just technical strength behind it, and the stablecoin growth story could well be the kind of fundamental tailwind that helps carry a move that far if broader sentiment cooperates.
On the other side, the trendline itself is the level that matters most for anyone doing SUI technical analysis right now.
A break and close below $0.6970 would signal the trendline has failed to hold, and that is only about 8.9% below the current price, so this is not a distant risk. If that level gives way, the next support sits at $0.6358, close to 16.9% under current price.
A slide down toward these levels would suggest the recent uptrend has run out of steam, at least for now, regardless of how strong the stablecoin numbers look on paper.For the moment, SUI is at a genuine crossroads, trendline support holding just barely, and a strong fundamental narrative building in the background that could tip the balance if
the technical picture cooperates.
Chart Source: TradingView, SUIUSDT Perpetual Contract, Bybit, 4-hour timeframe, September 10, 2026.
Support and Resistance Levels
Resistance 2
$1.1671
+52.50%
Resistance 1
$0.9554
+24.84%
Near-term hurdle
$0.8442
+10.31%
Current Price
$0.7653
--
Support 1
$0.6970
-8.92%
Support 2
$0.6358
-16.92%
Bull, Base, and Bear Case
In the bull case, SUI holds the ascending trendline, breaks above $0.8442, and works its way toward $0.9554 with $1.1671 as the stretch target if the stablecoin growth narrative keeps drawing fresh capital into the ecosystem.
The base case has SUI continuing to hover right around the trendline, testing it a few more times without a decisive close either way, while the market digests the stablecoin supply news alongside broader crypto conditions.
The bear case shows up if the trendline finally breaks and SUI closes below $0.6970. In that scenario, a slide toward $0.6358 becomes the more likely path, even with the stablecoin growth story still intact in the background.
Risks to This Outlook
Stablecoin supply growth is a positive fundamental signal, but it does not always translate into immediate price strength, since stablecoins can sit on a chain for liquidity or trading purposes without directly lifting the native token's price.
Broader Bitcoin sentiment, a wider market pullback, or a sudden shift in risk appetite could all pressure SUI independently of both the trendline setup and the stablecoin narrative, so these levels should be treated as a guide rather than a certainty.
Glossary
Ascending trendline: a rising support line connecting a series of higher lows, used to judge whether buyers are consistently stepping in at progressively higher prices.
Stablecoin supply: the total value of stablecoins issued and held on a given blockchain, often used as a proxy for on-chain liquidity and real economic activity.
Open interest: the total value of outstanding futures and perpetual contracts that remain unsettled, often used as a gauge of active leveraged positioning.
4-hour close: the final traded price at the end of a 4-hour candle, used here as the confirmation trigger for breakout or breakdown scenarios.
Disclaimer
This article is for informational purposes only and does not constitute financial advice. Cryptocurrency markets are highly volatile, and price predictions are based on technical analysis of historical chart patterns, which do not guarantee future outcomes. Readers should conduct their own research and consult a qualified financial advisor before making any investment decisions.