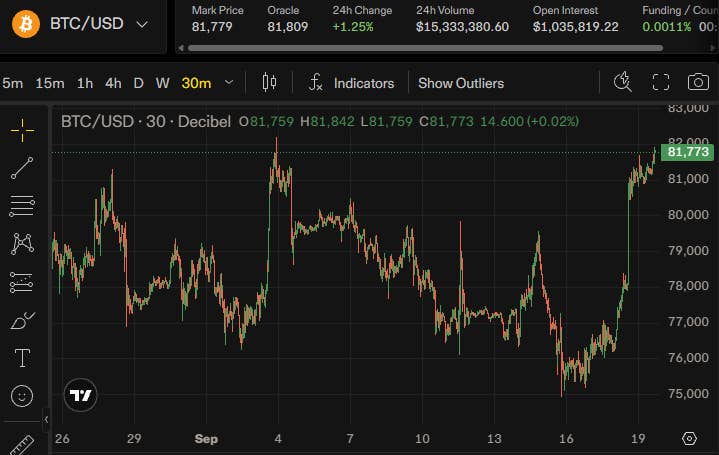
Gold price is near $4,400 after a period in which cryptocurrencies have delivered stronger short-term gains. Bitcoin’s rally above $81,500 and renewed interest in altcoins have drawn attentio
Gold price is near $4,400 after a period in which cryptocurrencies have delivered stronger short-term gains. Bitcoin’s rally above $81,500 and renewed interest in altcoins have drawn attention toward the crypto market, but gold’s longer-term chart still has a bullish interpretation, according to analyst DeepValue Signal.
In a brief post on X, the analyst shared a weekly gold chart alongside a straightforward forecast: “Keep it simple. See you at $6,500+.”
That target would represent a gain of roughly 48% from $4,400. The analyst did not provide a deadline, making the chart’s technical structure particularly important for understanding the prediction.
Why DeepValue Signal Sees Gold Above $6,500
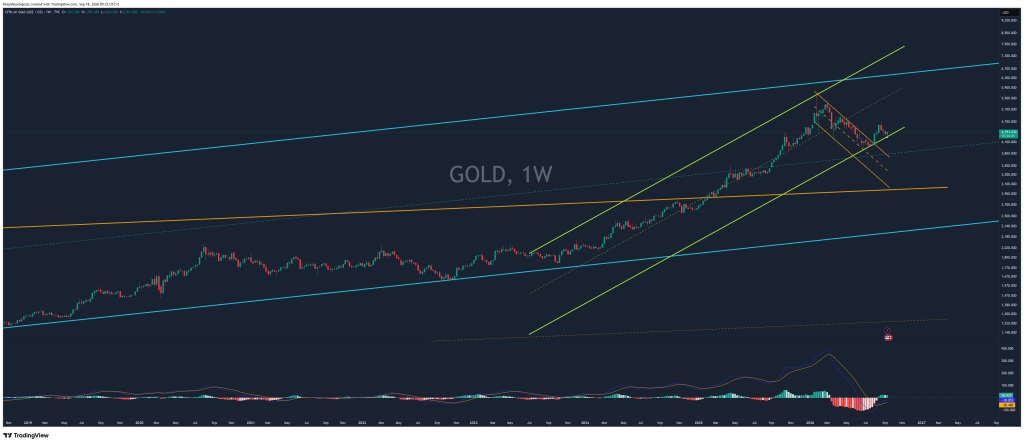
DeepValue Signal’s weekly chart shows gold trading within two overlapping upward-sloping channels.
The wider channel, drawn in blue, captures the metal’s longer-term advance dating back to 2018. A steeper green channel tracks the more recent rally, which accelerated through 2024 and 2025 before reaching a peak above $5,000 in early 2026.
Gold subsequently pulled back toward the lower boundary of that steeper channel. The chart shows buyers returning around the $3,800–$4,000 region, followed by a recovery toward $4,400.
That rebound is central to the analyst’s bullish case. If the lower green trendline continues to hold, the recent decline could prove to be a correction within the broader uptrend rather than the beginning of a prolonged downturn.
The $6,500 target also sits near an important area on the chart: the upper boundary of the longer-term blue channel. A move toward that level would therefore amount to a test of major technical resistance, not simply an arbitrary price projection.
The analyst’s green channel extends even higher, but those projected trendlines are scenarios rather than evidence that the gold price will reach them.
Gold Price Chart: The Levels That Matter Before $6,500
Key Level
Gold Price
Significance
Analyst’s target
$6,500+
Approximately 48% upside from $4,400; no target date provided
Near-term resistance
$4,600–$4,800
First major resistance zone
Previous peak area
$5,000–$5,300
Key hurdle before a larger rally
Immediate support
$4,000–$4,200
Important area for maintaining the bullish setup
Deeper support
$3,800
Potential support if the current recovery fails
Approximate zones interpreted from DeepValue Signal’s weekly chart, not confirmed live market quotes.
The chart indicates that gold must first overcome resistance around $4,600–$4,800. A sustained move above that region would bring the previous peak above $5,000 back into focus.
 Source: X/@DVSignals
The weekly MACD indicator also shows early signs of improvement. Its histogram has turned positive after a prolonged negative period, while the MACD line is recovering toward its signal line. This points to easing bearish momentum, although it does not guarantee a sustained rally.
On the downside, the rising green channel boundary and the $4,000–$4,200 area are important to monitor. A breakdown below that region would weaken the immediate bullish setup, with approximately $3,800 emerging as another potential support area.
Can Gold Reach $6,500 While Crypto Is Rallying?
Bitcoin and several altcoins have recently outperformed gold over shorter periods, but that does not necessarily invalidate the precious metal’s longer-term trend. The two markets respond to different combinations of liquidity, interest-rate expectations, investor demand and risk appetite.
For gold to approach $6,500, it would likely need to reclaim its previous highs and maintain buying pressure through several resistance levels. A stronger dollar, higher real yields or fading demand could delay or undermine that scenario.
For more financial news and price predictions, click here.
Subscribe to our YouTube channel for daily crypto updates, market insights, and expert analysis.
The post This Analyst’s Gold Price Prediction Is Surprisingly Simple appeared first on CaptainAltcoin.