What is the XRP price today? $XRP price is trading around $1.08, based on current market data. The token is down about 1.8% over the past day. It has been stuck in a tight range. Buyers keep
What is the XRP price today?
$XRP price is trading around $1.08, based on current market data. The token is down about 1.8% over the past day.
It has been stuck in a tight range. Buyers keep showing up between $1.00 and $1.05. Sellers keep showing up near $1.15 to $1.17.
This kind of sideways move often happens when traders wait for one big news event.
Many traders following the latest XRP Price Prediction see this range as a pause rather than a clear trend in either direction.
What is the CLARITY Act and why does it matter for XRP?
The CLARITY Act is a US bill. It would treat XRP more like a commodity under the law, not a security.
That matters a lot for banks and big funds. Clear rules make it easier for them to hold and trade the altcoin.
The bill already passed some early steps. But the full Senate floor vote keeps getting pushed back. Many now expect it in late July or August instead of earlier target dates.
Markets do not like uncertainty. That is a big reason the price has stayed range-bound instead of trending hard in one direction.
Any XRP price prediction made right now has to account for this regulatory overhang first.
What is the XRP futures and options data showing?
CoinGlass Derivatives data adds more color to the picture:
Metric
Value
24h Change
Futures Volume (24h)
$1.89B
+1.95%
Open Interest
$2.37B
-2.20%
Options Volume
$1.10M
-95.93%
Options Open Interest
$62.88M
-6.05%
Open interest falling while price also falls often means some leveraged long traders are closing positions rather than adding new risk.
Options volume dropped sharply too, which points to traders sitting on the sidelines ahead of the CLARITY Act news.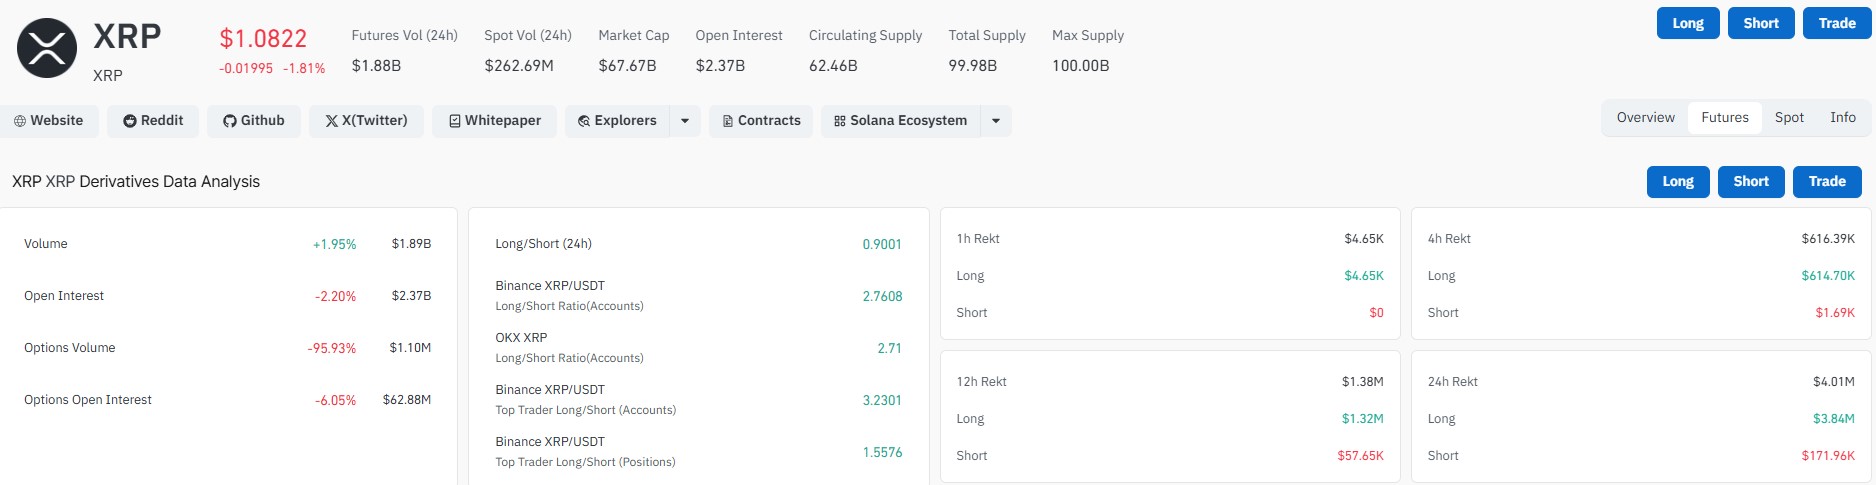
Are XRP traders long or short right now?
Long/short data from major exchanges shows more traders positioned long than short right now.
Binance long/short ratio (accounts): 2.76
OKX long/short ratio (accounts): 2.71
Binance top trader long/short (accounts): 3.23
A ratio above 1 means more accounts are long than short. That lines up with the idea that many retail traders expect a bounce, even with price stuck below resistance.
How much $XRP got liquidated in the last 24 hours?
Liquidation data shows where leveraged bets have been wiped out.
Timeframe
Total Rekt
Long
Short
1h
$4.65K
$4.65K
$0
4h
$616.39K
$614.70K
$1.69K
12h
$1.38M
$1.32M
$57.65K
24h
$4.01M
$3.84M
$171.96K
Most of the liquidations over the past day hit long positions. That fits with the recent price dip, where traders betting on a quick move up got squeezed out.
Are $XRP whales buying or selling?
An analyst tracked the gap between whale and retail trading activity on Binance. That spread narrowed to around 35%, close to levels seen back in early May.
This gap only measures how active whales are compared to retail traders. It does not by itself say whether whales are buying or selling. Still, a shrinking gap can signal a shift in market structure worth watching.
Separately, $XRP saw a net inflow of roughly $6.78 million into exchanges recently, according to data trackers.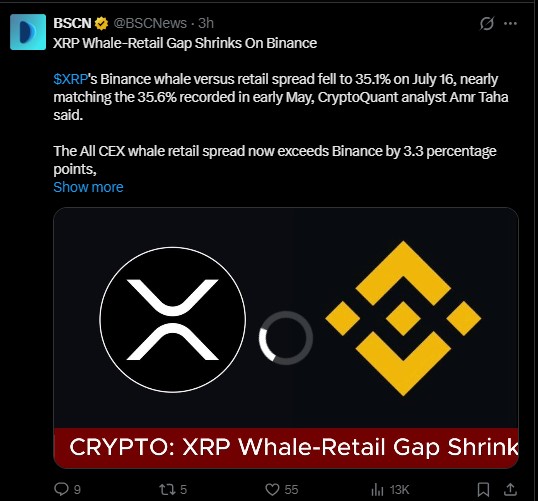
Why is XRP price up or down today?
A few other stories are shaping sentiment:
Ripple's RLUSD stablecoin keeps expanding, and the company is working on lending tools and tokenized asset support on the XRP Ledger.
In Japan, SBI Digital Finance and Doppler Finance are building XRP-based settlement systems for local banks.
Spot ETFs launched late last year and have added steady, if slower, institutional demand.
The SEC case against Ripple wrapped up earlier this year, removing a major legal cloud that hung over XRP for years.
None of these are instant price triggers. But together they support the idea of steady, long-term demand even during quiet weeks.
Will XRP price go up or down next?
Support sits at $1.00 to $1.05. This zone has held for weeks and lines up with a large cluster of past buyer activity.
Resistance sits near $1.12 to $1.17. The price has failed to close firmly above this zone in recent attempts.
A confirmed break above $1.17 could open the door toward $1.20 and beyond, especially if paired with good CLARITY Act news.
A break below $1.00 could expose lower levels, since fewer buyers have historically stepped in below that mark.
Some chart watchers point to longer-term measured-move targets built from moving average setups, calling for much higher levels over time.
These are speculative technical models, not guaranteed outcomes, and should be treated as one opinion among many rather than a forecast.
One such theory circulating among chart traders lays out a multi-step roadmap. It calls for the altcoin to hold the 111-day simple moving average, reclaim the 33-day exponential moving average, then break and close above the $1.60 to $2.00 zone.
Only after all three steps happen, the theory argues, would a much larger "measured move" pattern activate, with chart-based extensions pointing toward $17, then $35, and finally $42 as a full technical target.
Bottom line
The altcoin price is in a holding pattern. The CLARITY Act vote is the main event traders are waiting on, and its delay has kept price boxed in.
Derivatives data shows long traders taking most of the recent liquidation pain, while long/short ratios still lean bullish.
Whether the price pushes past $1.17 or slips under $1.00 may come down to what happens in Washington over the next few weeks.
Any short-term XRP price prediction or longer-range XRP price forecast should treat that vote as the key swing factor for now.
Disclaimer
This article is for informational purposes only and does not constitute financial, investment, or trading advice. Cryptocurrency markets are highly volatile and carry significant risk of loss. Always do your own research and consult a licensed financial advisor before making investment decisions.