ZEC just posted its biggest single-day drop in this whole rally, falling 12% and slipping below its short-term average. This Zcash Price Prediction October 2026 looks at whether the rising ch
ZEC just posted its biggest single-day drop in this whole rally, falling 12% and slipping below its short-term average.
This Zcash Price Prediction October 2026 looks at whether the rising channel still holds or whether this is the first real crack in the trend.
Why Is ZEC Down Today?
The Zcash price today was down 12% to $1,376.75 over 24 hours, sharply underperforming a broader market that was only modestly lower.
The primary driver was a derivatives-driven selloff, with $10.08 million in long positions liquidated in a single hour, forcing rapid selling and accelerating a technical breakdown after ZEC's massive September rally.
Secondary pressure came from profit-taking after the parabolic run and spillover from a risk-off macro environment.
Bitcoin's stability and the start of split-adjusted trading on the Grayscale Zcash ETF, beginning September 30, are both worth watching from here.
Zcash Price Today: Technical Analysis
ZEC has been climbing inside a clear rising channel since mid-August, moving from under $500 to a high near $1,700 in the last week.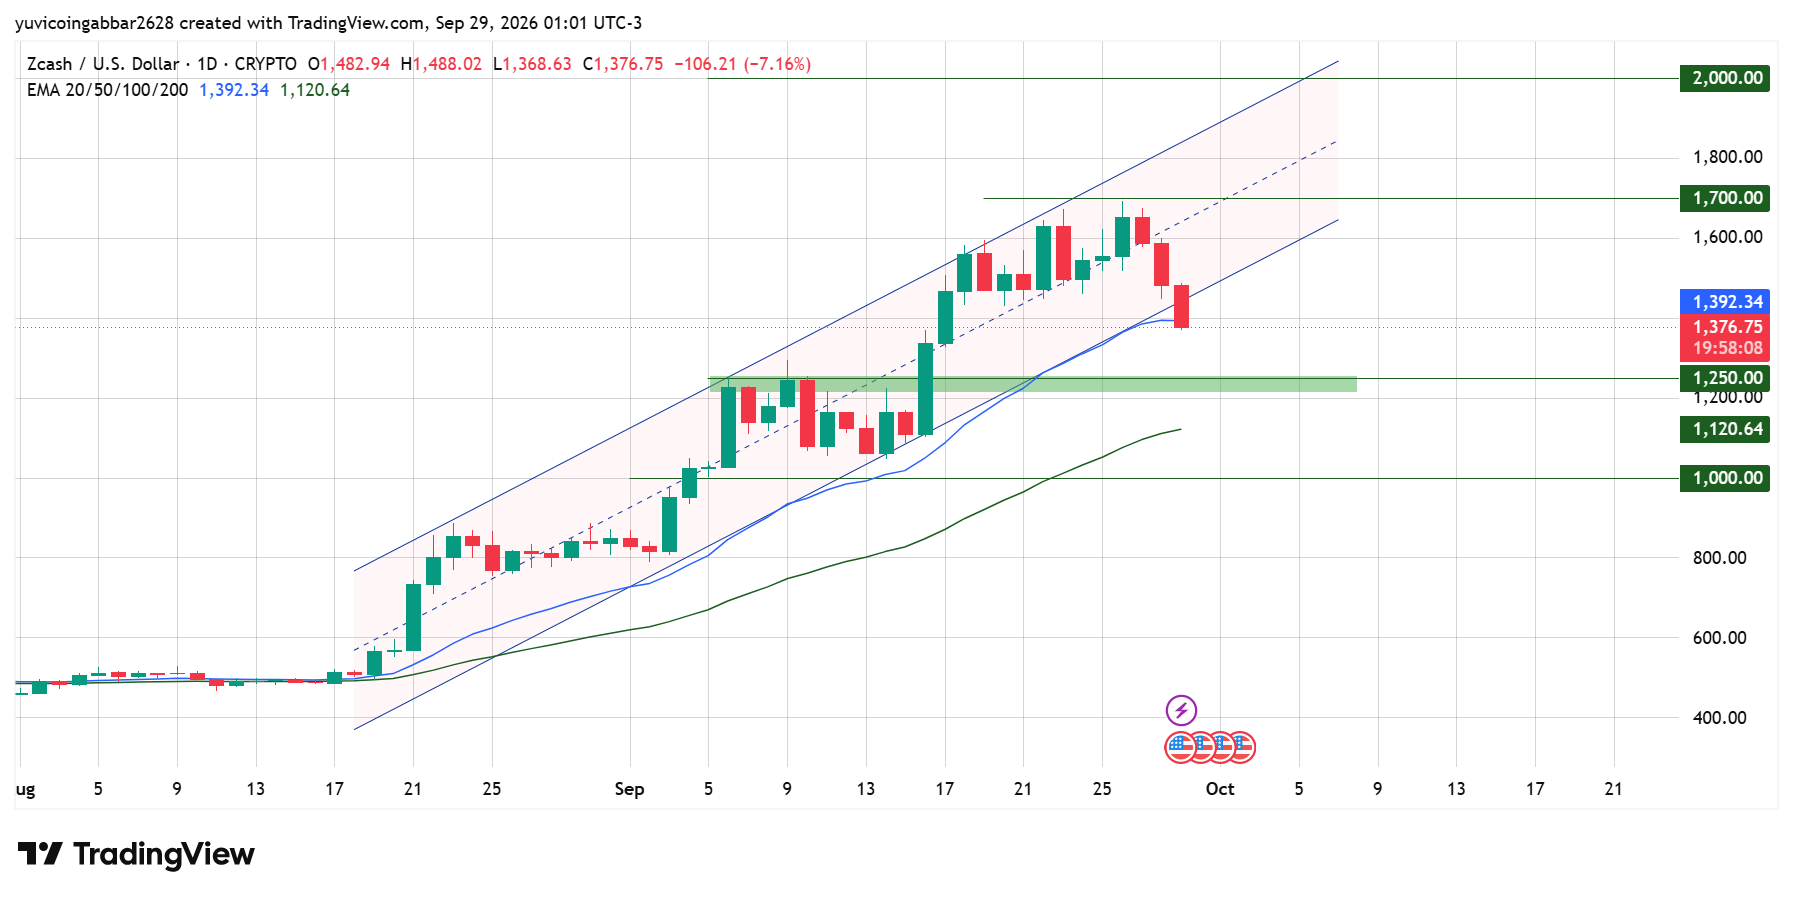
Along the way, the $1,250 zone acted as a launchpad in early September, where price paused for about a week before pushing higher.
Today breaks that pattern. After topping out near $1,700, ZEC fell sharply, opening at $1,482.94 and closing at $1,376.75, a drop of $106.21, or 12%.
This is the single largest daily drop on the whole chart. The candle also closed below the 20 EMA at $1,392.34, which had supported the price through most of September.
The price is now sitting below the channel. That line has held on every earlier test since August, so this is the first time the whole structure is being seriously challenged.
Below it, the $1,250.00 zone is the next clear support, since it already worked once before as a base.
The 50 EMA is much further down, at $1,120.64, which shows how far today's candle has closed the gap between price and the slower average.
Zcash Outlook Key Levels
Level Type
Price
Resistance 2
$2,000.00
Resistance 1 (recent high)
$1,700.00
Current Price
$1,376.75
First Confirmed Support
$1,250.00
Deeper Support
$1,000.00
Zcash Price Forecast
Bull case: If the price holds the $1,250.00 support zone, this drop would look like a normal pullback after a very fast rally. A close back above $1,392.34 would show buyers stepping back in, with $1,700.00 as the level to reclaim after that.
Bear case: A close below $1,250.00 would break the support structure. That would be the first real sign the rally is over, and it would put the 50 EMA at $1,120.64 and then $1,000.00 in view.
Zcash Price Prediction October 2026: Can Zcash Reach $2,000?
$2,000.00 is the highest level marked on the chart. To reach it, ZEC would first need to reclaim $1,392.34 and then clear $1,700.00, the level it was just rejected from. After a 12% drop, holding the support comes first, before that target becomes realistic again.
Zcash Price Prediction: Expert View
According to CoinGabbar analysts, a single 12% red candle after such a fast climb is not unusual, but it is the first time this channel has actually been broken rather than just touched at the edge.
The $1,250.00 zone is the level that matters most here, since it already proved it can hold buyers once before.
Disclaimer
This piece is for informational purposes only and isn't financial advice. The levels and scenarios above are based on technical chart analysis and publicly available data at the time of writing. Crypto markets can move sharply within hours, so past patterns don't guarantee future outcomes. Do your own research and consider your risk tolerance before acting on any level discussed here.