The Zcash Price Prediction talk is back, and a stalled ETF flow is part of the reason. Compare that to the Bitcoin price prediction coverage, where fund flows move the chart just as often as
The Zcash Price Prediction talk is back, and a stalled ETF flow is part of the reason. Compare that to the Bitcoin price prediction coverage, where fund flows move the chart just as often as technicals do.
ZEC just posted something similar. According to BSCN, spot Zcash ETFs logged two straight days of zero flow activity, a sharp reversal after an eight-day streak of multi-million-dollar inflows.
Zcash launched in 2016 as a privacy-focused cryptocurrency, using a technology called zero-knowledge proofs to let transactions stay verifiable without exposing sender or receiver details.
That privacy angle has kept Zcash Coin in a different lane from most large-cap tokens. And this year's spot ETF launch pulled it into a more mainstream conversation.
ZEC is trading near $1,538.31, down 3.2% on the day. Market cap sits around $26.078 billion, with circulating supply close to 16.952 million tokens against a 21 million max supply.
The Zcash price today shows a token cooling off after a strong run.
Live Market Data
Metric
Value
Price
$1,538.31
24H Change
-3.2%
24H Range
$1,518.32 - $1,622.95
Market Cap
$26.078B
Source: market data taken from CoinGecko, as of Sep 26, 2026. Figures may vary slightly across other tracking websites.
Zcash News Today: $ZEC ETF Flow Update
BSCN flagged something traders can't ignore. And spot ZEC ETF products, published around Sep 25, 2026, 23:46 UTC, recorded two consecutive days with zero flow activity, a clean stop after weeks of steady buying.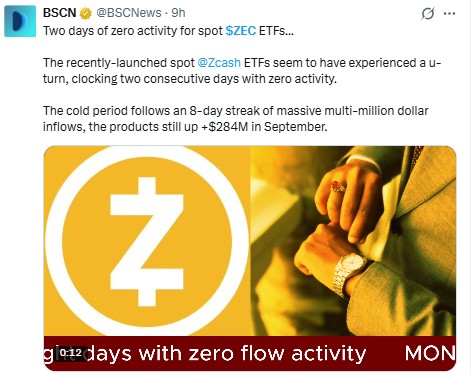
Source: Data Taken From @BSCNews, X Account, as of Sep 26, 2026
That cold spell follows an eight-day streak of heavy inflows. But the products remain up more than $284 million for September alone, even with the pause.
Fine. Two quiet days don't erase a month of demand on their own.
Technical Analysis
This Zcash technical analysis starts with the structure squeezing price on the 4-hour chart.
ZEC sits inside an ascending channel, a pattern where price climbs between two parallel rising lines, and it's currently trading near the channel's lower boundary. 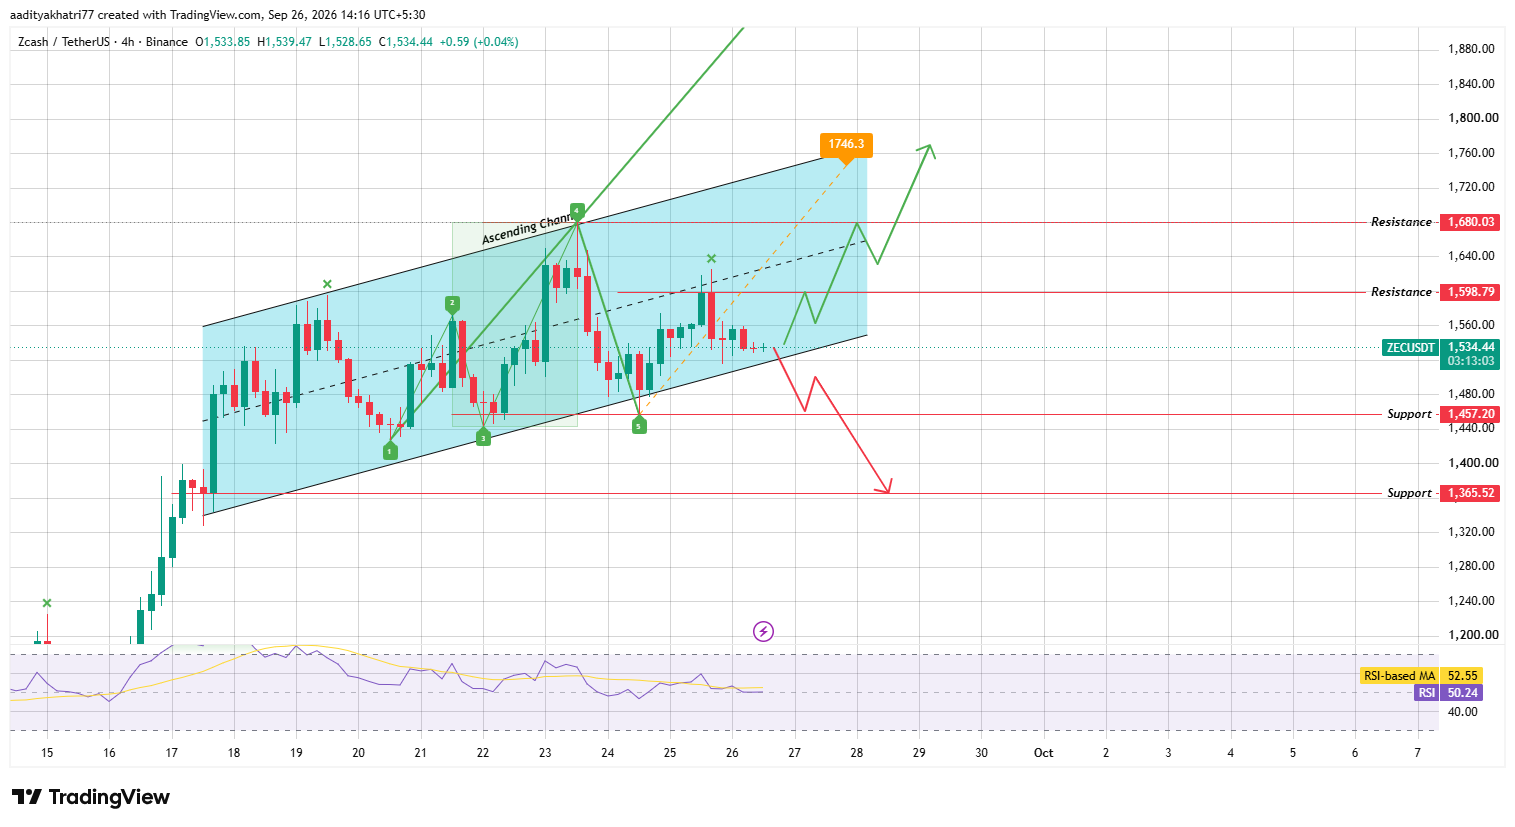
Source: Chart taken from TradingView, as of Sep 26, 2026
RSI reads 50.24, just below its moving average of 52.55.
That's a neutral read, not a strong signal either way, and the channel test right now is the real tell.
Can $ZEC Push Toward Higher Resistance?
A bounce off the lower boundary followed by a break above $1,598.79 on real volume opens the door toward $1,680.03 next.
A wolfe wave structure on the same chart marks five swing points and projects an extended move toward $1,746.30 if buyers stay in control.
That's the bullish case. And it needs the channel to hold first, not just a green candle or two.
What Happens If $ZEC Breaks the Channel?
Rejection at resistance changes the picture fast. And a break below the channel's lower boundary would send $ZEC toward $1,457.20 support. Lose that too, and $1,365.52 becomes the next real floor.
Breakdowns from ascending channels tend to move sharp once the lower boundary fails.
Turns out, a stalled ETF flow and a broken channel would send the same message at the same time.
Support
Resistance
$1,457.20
$1,598.79
$1,365.52
$1,680.03
Bull, Base, and Bear Scenarios
Scenario
Setup
Level
Bull
Channel breakout with volume
$1,598.79 to $1,746.30
Base
Channel holds, range trade
$1,457.20 to $1,598.79
Bear
Channel breakdown
$1,365.52 to $1,457.20
Zcash vs Bitcoin
Bitcoin's own price action tends to set the liquidity backdrop for mid-cap privacy coins like $ZEC. A risk-on tape helps channel breakouts stick and keeps ETF demand flowing.
A risk-off move tends to drag ZEC's support levels lower regardless of what the privacy narrative is doing that week.
Methodology
This Zcash Price Prediction was built from a 4-hour ZECUSDT chart sourced through Binance via TradingView, checked candle by candle for the channel boundaries and the wolfe wave swing points.
Support and resistance levels came directly from the marked price zones on that chart. Live price, market cap, and ETF flow figures came from separate data snapshots taken the same day.
Nothing here substitutes for independent research; markets move fast, and a chart pattern only describes probability, not certainty.
Expert Opinion
Market commentary around Zcash News this week leaned cautious after the ETF pause.
Analysts tracking the fund data noted the September inflow total still points to real demand, while the two-day stall raises a fair question.
Does a single cold spell signal exhaustion or just a pause before the next leg?
Either way, the channel test at $1,598.79 will likely answer that faster than any ETF report could.
Disclaimer: This article is for informational purposes only and does not constitute financial advice. Cryptocurrency markets, including Zcash, carry high volatility and downside risk; prices can move sharply against any projected level, and past performance offers no guarantee of future results. Readers should conduct independent research before making any investment decision.