CryptoQuant’s altcoin sell-pressure reading has fallen to a multi-year extreme, with the cumulative buy-sell volume difference for altcoins excluding Bitcoin and Ethereum at about -$209 billi
CryptoQuant’s altcoin sell-pressure reading has fallen to a multi-year extreme, with the cumulative buy-sell volume difference for altcoins excluding Bitcoin and Ethereum at about -$209 billion.
The metric tracks the difference between spot market buy volume and sell volume across altcoins outside BTC and ETH. A negative reading means sell volume has exceeded buy volume over the measured period.
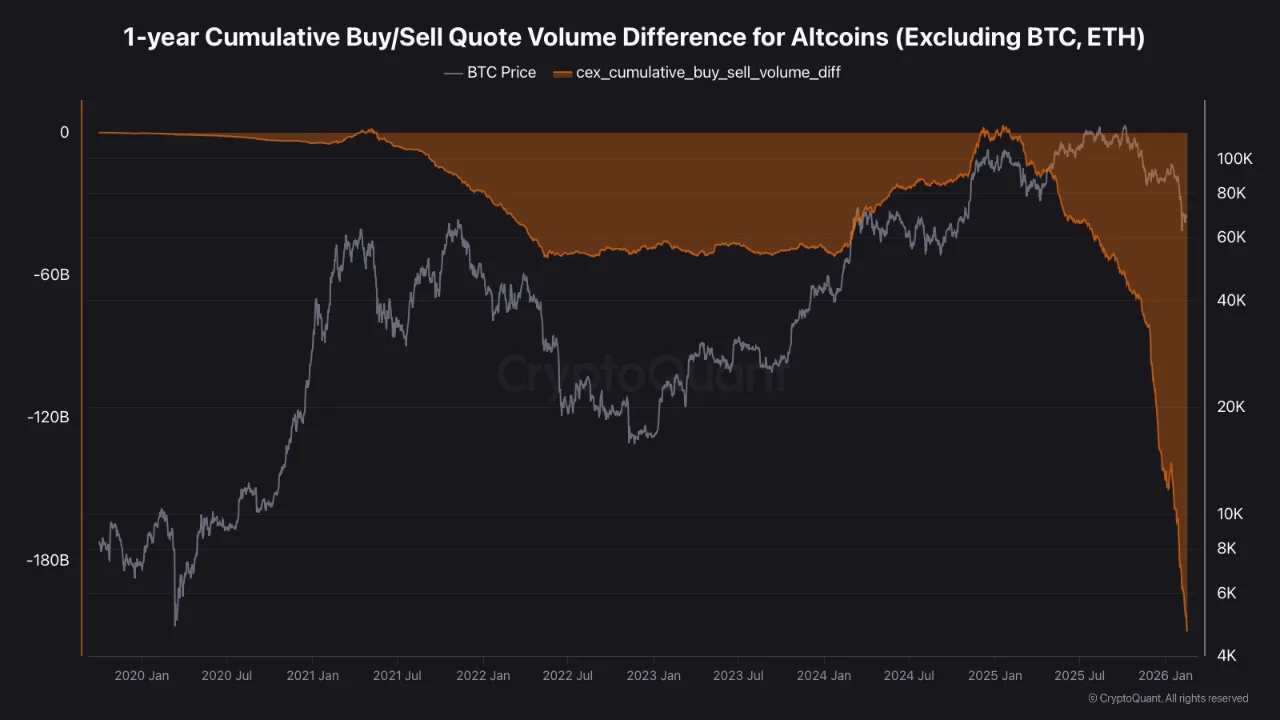
Cumulative Buy/Sell Diff (alts, ex-BTC/ETH): -209B. Source: CryptoQuant
The decline has persisted for 15 straight months of net spot selling. The reading was near zero in January 2025, before altcoin order flow turned steadily negative across centralized exchanges.
The same pressure has shown up in broader market activity. Centralized exchange spot volume recently fell to its lowest level since October 2023, with fewer traders adding risk while prices remained under pressure.
Most Binance Altcoins Trade Below 200-Day Averages
A separate CryptoQuant quicktake showed that about 84% of Binance-listed altcoins were trading below their 200-day moving averages.
The 200-day moving average is widely used to track long-term trend strength. Trading below that level does not mean every token will keep falling, but a broad share of assets below the threshold shows weak participation across the altcoin market.
CryptoQuant analyst Darkfost said the current underperformance phase has lasted nearly eight months, making it the second-longest stretch of broad altcoin weakness since 2020. The same analysis noted that the Total 3 market-cap metric, which excludes Bitcoin and Ethereum, has also fallen below its 200-day moving average on the weekly chart.
The technical weakness follows a wider market reset in which the crypto market fell into extreme fear after Bitcoin, Ethereum and major altcoins weakened together.
Altcoin Season Signals Remain Weak
The latest data does not confirm a market bottom. Long periods of net selling can precede rebounds, but they can also continue while liquidity stays concentrated in Bitcoin, stablecoins and a small number of large-cap assets.
Altcoin recovery would need stronger spot demand, broader participation above long-term moving averages and a reversal in cumulative buy-sell volume. Without those changes, the market remains defined by distribution rather than rotation into higher-risk tokens.
Ethereum has also remained under pressure despite recent technical reversal signals. ETH recently flashed a monthly TD Sequential buy signal, but that setup has not yet reversed the broader weakness across non-BTC assets.
As of the latest CryptoQuant readings, altcoins excluding Bitcoin and Ethereum showed a cumulative buy-sell volume difference near -$209 billion, while about 84% of Binance-listed altcoins traded below their 200-day moving averages.
The post Altcoin Sell Pressure Hits Multi-Year Extreme In CryptoQuant Data appeared first on Crypto Adventure.