Arbitrum is trading at $0.1922 on October 19, 2026. That's a 4.63% jump in the last 24 hours. In this Arbitrum price prediction, look at the market data, the new program, derivatives data, ho
Arbitrum is trading at $0.1922 on October 19, 2026. That's a 4.63% jump in the last 24 hours.
In this Arbitrum price prediction, look at the market data, the new program, derivatives data, holder concentration, and the 4-hour chart.
Arbitrum 24hrs Market Data
Arbitrum is one of the better-known Layer 2 token projects. Here's where it stands right now at $0.1922.
Metric
Value
Price
$0.1922 (up 4.63% in 24h)
Market cap
$1.32B
24h trading volume
$120.7M (up 27.43%)
Volume to market cap ratio
9.02%
Fully diluted valuation
$1.92B
Circulating supply
6.89B ARB
Max supply
10B ARB
Source: Data taken from CoinMarketCap
Bitcoin Is Green, and Altcoins Are Following
The BTC price is up 1.15%, and its volume is up 64.14% in 24 hours, which shows fresh demand across the market. $ARB is up 4.63% on the same day, roughly four times Bitcoin’s move.
That’s the usual pattern. Smaller coins like $ARB tend to move more than Bitcoin, both up and down, so it helps to follow our Bitcoin price prediction.
So Bitcoin's green day is one reason $ARB is bouncing at $0.1922. The flip side is that a Bitcoin pullback could pull $ARB lower fast.
Arbitrum Open Interest Is Cooling Off
Source: Data taken from CoinGlass
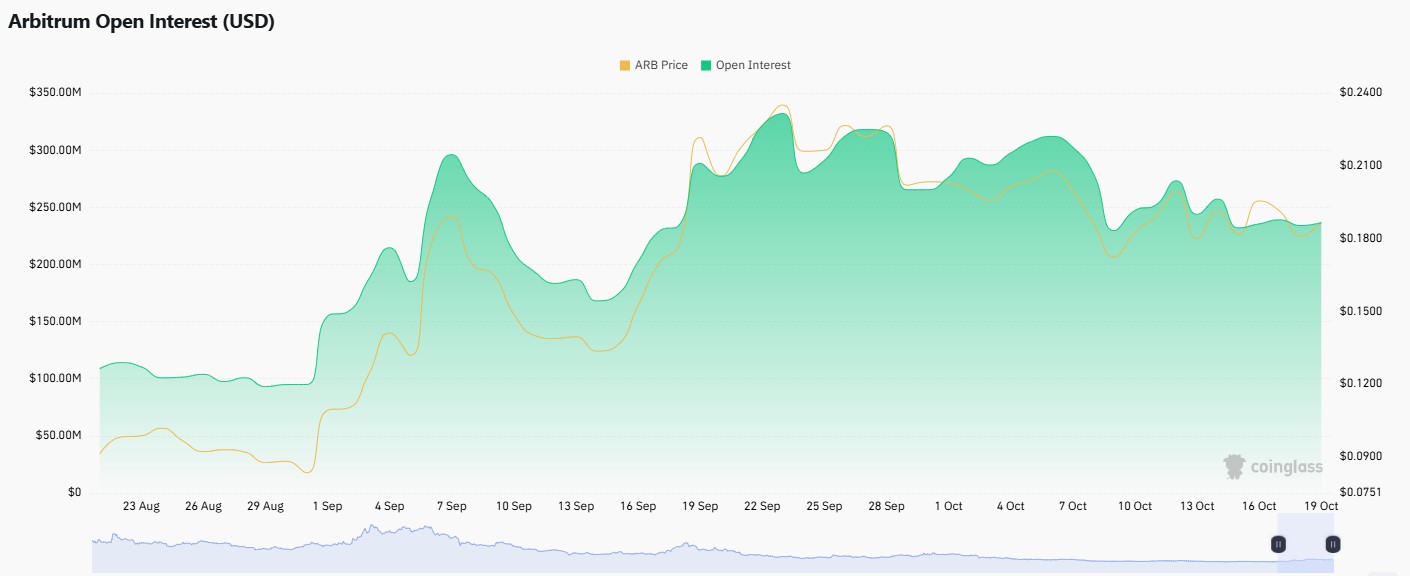
The open interest chart tells a clear story. It sat near $100M in late August, then climbed to roughly $330M in late September.
Price was above $0.23 at that peak. Since then, open interest has slipped to about $237M, a drop of around 28%.
$ARB has also fallen from that peak to $0.1922. So leverage and price have cooled together.
Arbitrum Liquidation Data
Source: Data taken from CoinGlass
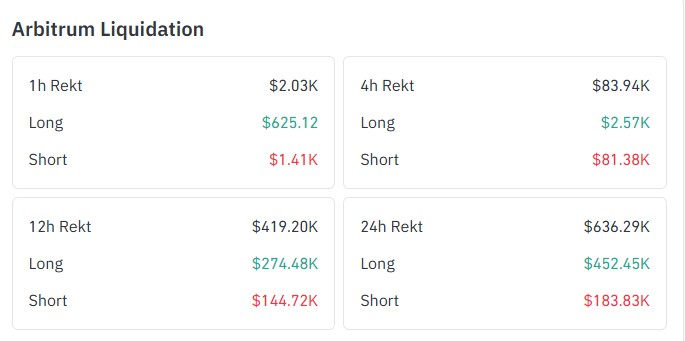
This data shows $636.29K liquidated in 24 hours, with longs at $452.45K and shorts at $183.83K.
In the last 4 hours, this Arbitrum price prediction sees shorts making up about 97% of the $83.94K liquidated. That fits the bounce to $0.1922.
Arbitrum Futures Volume Data
Source: Data taken from CoinGlass
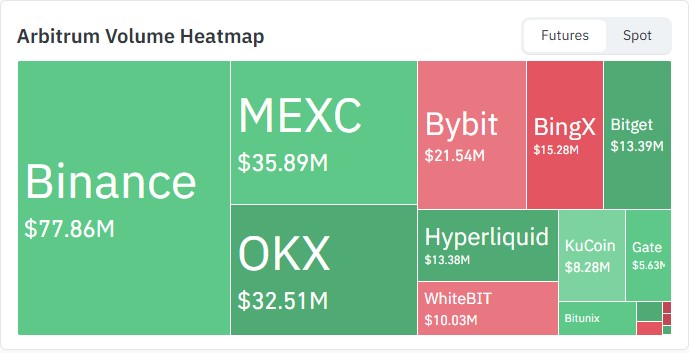
Binance leads the futures volume heatmap with $77.86M. MEXC follows at $35.89M and OKX at $32.51M.
Arbitrum Holders Concentration Data
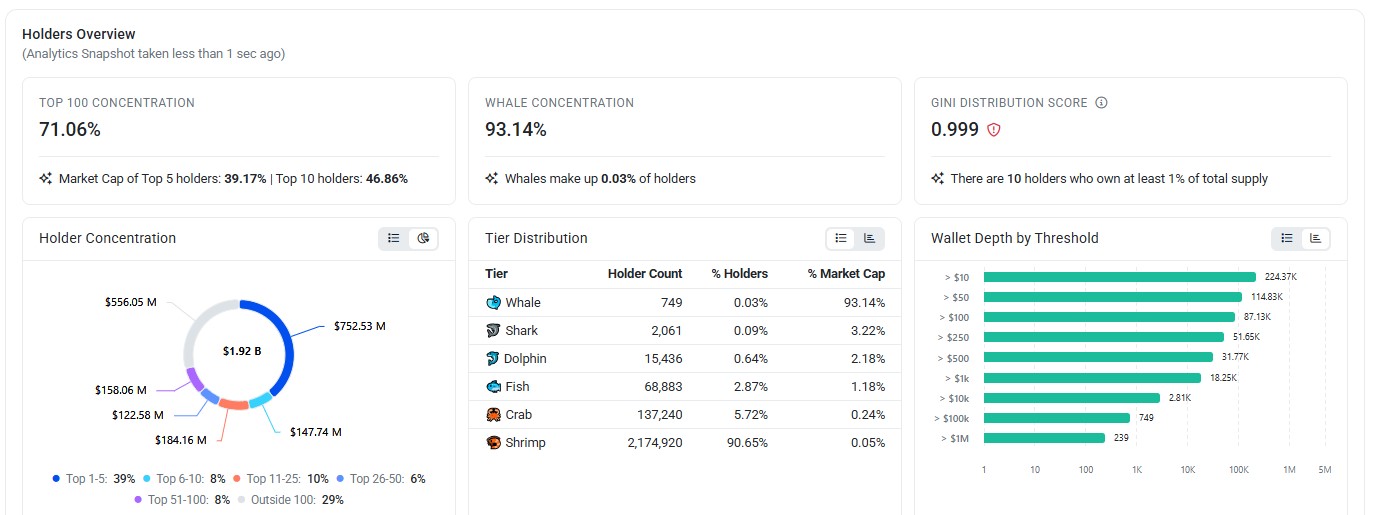
Source: Data taken from Arbiscan
The top 100 wallets hold 71.06% of $ARB. The top 5 hold 39.17%, and the top 10 hold 46.86%.
Ten holders own at least 1% of the total supply each. The Gini distribution score is 0.999, which means ownership is extremely uneven.
Whale wallets number just 749, or 0.03% of all holders. Yet they control 93.14% of the market cap tracked by the dashboard.
On the other side, shrimp wallets make up 90.65% of holders but only 0.05% of the market cap. Around 239 wallets hold more than $1M each.
This matters because a few large whale wallets can move prices quickly when they buy or sell.
$ARB Technical Analysis on the 4-Hour Chart
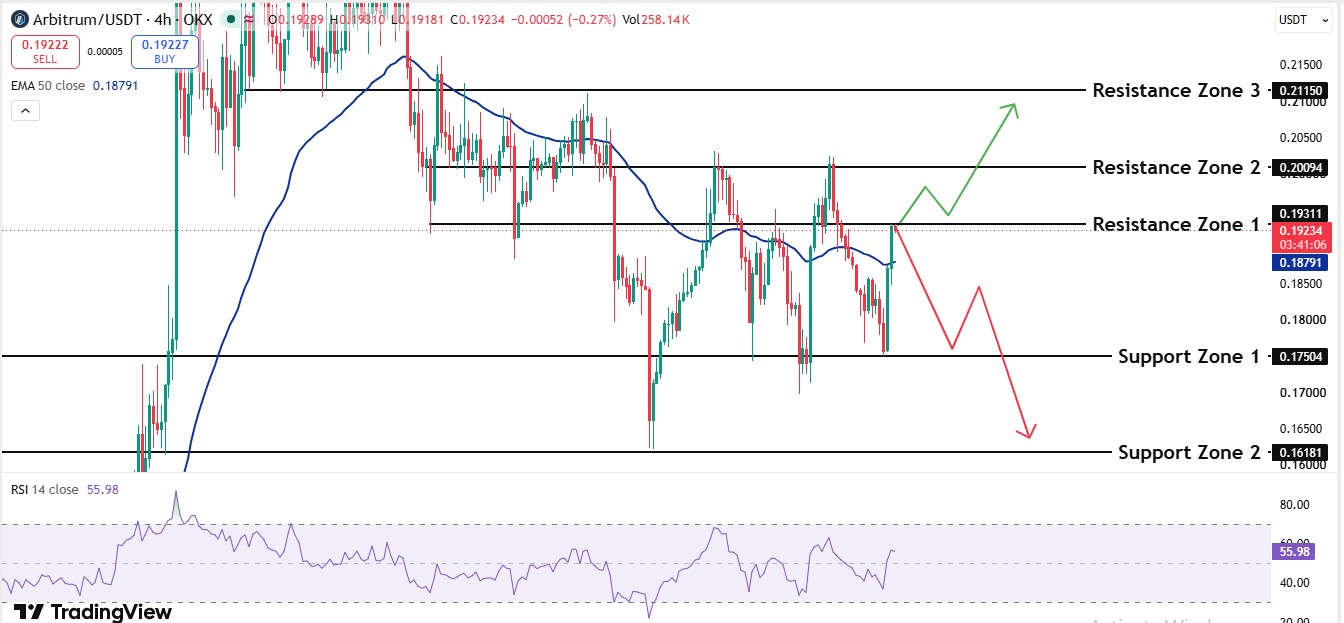
On the 4-hour chart, $ARB is trading at $0.1922. That's just below Resistance Zone 1 at $0.1931.
Price is also above the 50 EMA at $0.1879, which is about 2.23% below the current level. The RSI sits at 55.98, a neutral to slightly positive reading.
$ARB bounced from Support Zone 1 at $0.1750 and has been pushing higher since. Now it's testing the first ceiling.
Arbitrum price prediction: Bullish, Base, and Bearish Scenarios
Bullish: A 4-hour close above $0.1931 could send $ARB to $0.2009, then $0.2115.
Base: $ARB moves sideways between the 50 EMA at $0.1879 and $0.1931.
Bearish: A rejection at $0.1931 could pull $ARB toward $0.1879, then $0.1750 and $0.1618.
Scenario
Trigger
Targets
Bullish
4-hour close above $0.1931
$0.2009, $0.2115
Base
Price holds between $0.1879 and $0.1931.
Sideways range
Bearish
Rejection at $0.1931, then a close below $0.1879
$0.1750, $0.1618
Arbitrum price prediction: Support and Resistance levels
Level
Price
Resistance Zone 3
$0.2115
Resistance Zone 2
$0.2009
Resistance Zone 1
$0.1931
Support Zone 1
$0.1750
Support Zone 2
$0.1618
Also watch open interest. If it climbs again with price, momentum could build. If it keeps falling, the bounce may stall.
Arbitrum price prediction: Expert outlook
As per CoinGabbar analysis, we see Arbitrum at a decision point at $0.1922, sitting right under $0.1931. The Stablecoin Growth Program adds a positive story, but the heavy whale concentration and cooling open interest call for caution.
A close above $0.1931 favors buyers. A rejection puts $0.1750 back in play.
Disclaimer
This article is for information only and is not financial, investment, or trading advice. Crypto prices are highly volatile, and you can lose some or all of your money. Price targets mentioned here come from third-party analysts and are not guarantees. Always do your own research and speak with a licensed financial advisor before making any investment decision.