Arbitrum (ARB) is Ethereum's leading Layer-2 scaling network. After a strong July rally, this Arbitrum price prediction centers on ARB now testing an important resistance trendline. Traders a
Arbitrum (ARB) is Ethereum's leading Layer-2 scaling network. After a strong July rally, this Arbitrum price prediction centers on ARB now testing an important resistance trendline.
Traders are watching whether this breakout can trigger another bullish move.
The recent tap on this trendline has come with visibly lighter selling than the taps before it, and how ARB handles this zone could set the tone for the next leg.
Short answer: it comes down to whether ARB clears the descending trendline or gets rejected again, with the exact triggers laid out below.
Arbitrum Price Right Now
Metric
Value
Price
$0.0781
24h Change
+1.51%
Market Cap
$515.62M
Futures Volume (24h)
$63.84M
Spot Volume (24h)
$9.68M
Open Interest
$85.52M
Circulating Supply
6.61B ARB
Total Supply
10.00B ARB
Open interest here refers to the total value of ARB derivative contracts still open across exchanges, a rough gauge of active leveraged positioning.
Chart source: ARB/USDT 4-hour, TradingView, Binance data feed. Price, volume, market cap, and supply figures fromARB market data figures on CoinGlass, both captured on August 1, 2026, around 2:22 PM IST.
Methodology and Data Sources
This Arbitrum price prediction uses the 4-hour ARB/USDT chart on Binance via TradingView for price structure, with volume, open interest, and market cap figures from CoinGlass, liquidation flow from CoinGlass's ARB liquidation tracker, and ecosystem context from Arbitrum's own network activity reporting.
All levels are treated as invalidated only on a confirmed candle close beyond the stated trigger, not an intraday wick.
This is a short- to medium-term technical read, not a long-term Arbitrum price forecast.
Arbitrum Liquidation Data Today
Liquidation activity across the shortest windows shows longs taking almost all of the pressure.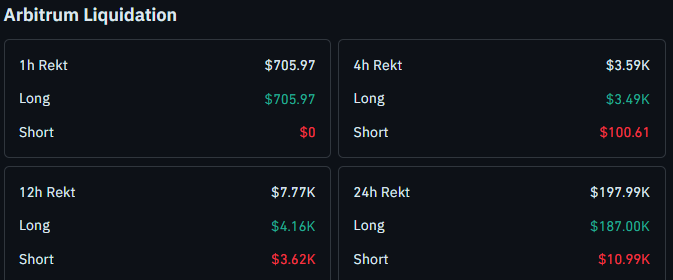
Over the past hour, $705.97 was liquidated, and all of it came from long positions, with zero short liquidations in that window.
The 4-hour figure tells a similar story, with $3.59K in total liquidations, made up of $3.49K from longs and just $100.61 from shorts.
The wider windows confirm the same lean. Over 12 hours, total liquidations reach $7.77K, with $4.16K from longs and $3.62K from shorts.
Across the full 24 hours, liquidations hit $197.99K, and longs account for $187.00K of that figure, while shorts make up just $10.99K.
This heavy long-side liquidation lines up closely with the earlier pullback into the descending trendline.
The full breakdown is available throughARB liquidation data breakdown on CoinGlass, checked August 1, 2026, around 2:22 PM IST.
$ARB News
According to an Arbitrum official X (formerly Twitter) post, principal member Immersve, a Mastercard-linked stablecoin card issuer, recorded a new all-time high (ATH) monthly stablecoin payment volume in July.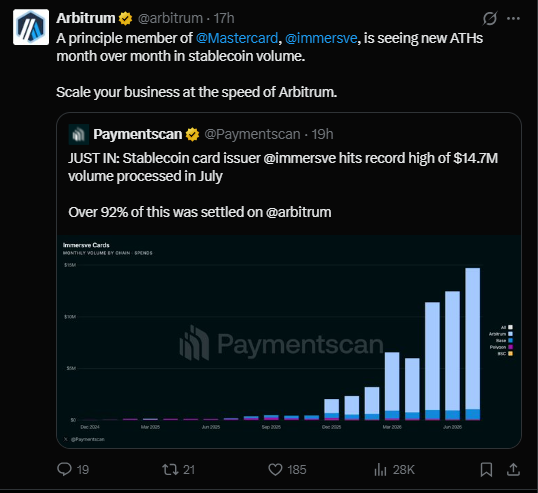
The update, citing Paymentscan data, states that over 92% of the record $14.7 million processed in July was settled on the Arbitrum network, highlighting growing real-world payment activity on the Layer-2 blockchain.
Key Takeaways
$ARB is testing the descending trendline that has capped every bounce since late July, with selling pressure noticeably lighter on the latest tap.
A close above $0.0803 opens the door to $0.0920 and $0.1013.
A close below $0.0753 shifts focus to $0.0705.
FreshArbitrum stablecoin volume update reporting shows a Mastercard-linked card issuer settling most of its record July volume on the network, adding ecosystem context to this ARB price forecast.
Liquidations over the past 24 hours have leaned heavily toward longs, matching the recent pullback into the trendline.
Quick Take: $ARB is trading near $0.0781. This is a short- to medium-term read based on the 4-hour chart.
A confirmed close above $0.0803 strengthens the bullish case, while a close below $0.0753 flips this Arbitrum price prediction bearish.
This article is for informational purposes only and is not financial advice. CoinGabbar and the analyst do not hold a position in ARB at the time of publication.
Arbitrum Price Prediction: 4-Hour Chart Analysis
On the 4-hour chart, $ARB has been respecting a descending trendline since late July, with each tap on that line producing weaker selling than the one before it.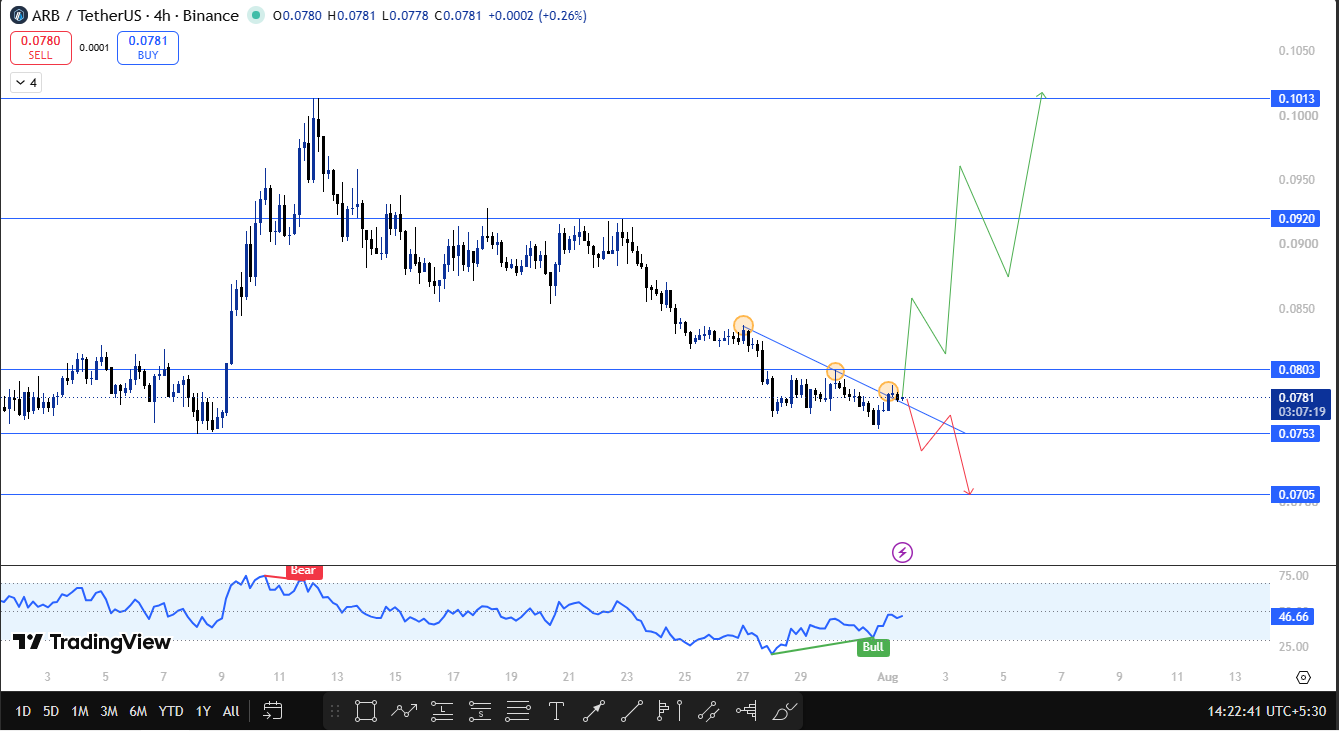
The latest tap has come with the lightest pressure yet, and the price is currently sitting right at the trendline rather than reversing sharply away from it.
If $ARB breaks and closes above $0.0803, the next resistance zone to watch is $0.0920, followed by $0.1013.
If instead the price break down the trendline and closes below $0.0753, that would confirm a breakdown, with $0.0705 becoming the next support in view.
Arbitrum Technical Outlook Snapshot
Indicator
Signal
Trend
Descending trendline since late July, price now testing the line directly
Structure
Selling pressure has weakened on each tap, follow-through not yet confirmed
Liquidations
Longs dominate every window from 1h through 24h
RSI
Reading near 46.66, with an earlier bearish divergence mark and a fresh bullish divergence forming near the recent low
BTC Correlation
Broader market tone is likely to matter as much as this chart structure
Arbitrum Support and Resistance Levels to Watch
Type
Level
Note
Resistance 3
$0.1013
Extended upside target
Resistance 2
$0.0920
Next hurdle after $0.0803
Resistance 1
$0.0803
Confirmation trigger for trendline breakout
Current Price
$0.0781
Testing the descending trendline
Support 1
$0.0753
Key closing-basis level, breakdown trigger
Support 2
$0.0705
Next, support if a breakdown is confirmed.
Risk-Reward Table
Case
Trigger
Target
Bull Case
Closes above $0.0803 on the 4-hour timeframe
Move toward $0.0920, then $0.1013.
Bear Case
Breaks and closes below $0.0753
Slide toward $0.0705.
Invalidation Level
This Arbitrum price prediction stays constructive as long as ARB holds near the descending trendline around $0.0781 on a closing basis.
A confirmed close below $0.0753 would confirm the breakdown and shift focus to $0.0705.
If $ARB instead breaks and closes above $0.0803, that is treated as evidence the trendline breakout has real follow-through, with $0.0920 and then $0.1013 opening up as targets.
How Bitcoin Could Influence ARB
This setup is based on $ARB's own 4-hour chart, but Bitcoin still tends to set the tone for how far altcoin moves like this one can extend.
If Bitcoin holds firm or trends higher, it generally improves the odds of ARB clearing the trendline and working toward $0.0920 and $0.1013.
A weaker Bitcoin tape, on the other hand, raises the risk that $ARB stays capped by the trendline and tests $0.0753 or $0.0705.
Many traders also watch Bitcoin dominance as a rough gauge of whether capital favors majors or altcoins, though this analysis does not track dominance figures directly and treats it only as general market context.
For a longer horizon view beyond this setup, our August 2026 $ARB outlook covers the wider picture, and readers tracking related exchange-token moves can also see how ARB has featured in therecent multi-exchange rally coverage.
Planned Update
This Arbitrum price prediction will be revisited if ARB confirms a close above $0.0803 or below $0.0753, or if fresh liquidation, volume, or network activity data meaningfully changes the setup described here.
The publish date will not be updated unless one of these material changes occurs.
Readers curious whether the $ARB revenge rally coverage still holds up, or how it compares with the earlier ARB breakout alert from July, can find that longer-range discussion in our archive, and broader coverage is available if youbrowse our price prediction hub.
Arbitrum Glossary
Descending Trendline: A downward-sloping line connecting successive lower highs, used to track resistance during a downtrend.Open Interest: The total value of derivative contracts, like futures, that remain open and have not yet been settled or closed.RSI (Relative Strength Index): A momentum indicator used to judge whether an asset has moved too far too fast in one direction.Bullish Divergence: When price makes a lower low but a momentum indicator like RSI fails to confirm it, it often signals weakening downside momentum.Liquidation: What happens when a leveraged trade gets forcibly closed because the trader ran out of margin to keep it open.
CoinGabbar's Technical Analyst View
The lighter selling pressure on this latest trendline tap is the key signal on this ARB chart, since each prior test since late July had produced sharper rejections.
What makes this test different is how closely price is holding right at the trendline rather than fading away from it, which suggests sellers may be losing conviction.
If $ARB breaks and closes above $0.0803, a move toward $0.0920 and then $0.1013 comes into view. A break and close below $0.0753 would point to $0.0705 as the next level to watch.
Disclaimer
This Arbitrum price prediction is based on technical chart analysis and market data available at the time of writing. Cryptocurrency markets are highly volatile, and prices can change rapidly. This content is for informational purposes only and should not be considered financial advice. CoinGabbar and the analyst do not hold a position in ARB. Always do your own research and consult a qualified financial advisor before making any investment decisions.