Will ASTER break $0.7196 level or slide back to $0.6741 this November? This Aster price prediction starts with a token price stuck at $0.7002 as of Nov 2, 2026, 11:00 UTC. That's just under t
Will ASTER break $0.7196 level or slide back to $0.6741 this November?
This Aster price prediction starts with a token price stuck at $0.7002 as of Nov 2, 2026, 11:00 UTC. That's just under the 50-day EMA at $0.7046, an average of recent daily prices that weighs newer days more. More market context sits in thelatest crypto news updates.
Aster Price Today: Market Snapshot
PerCoinGecko market data captured Nov 2, 2026, 11:00 UTC, ASTER ranks 53rd with a $1.755B market cap.
Metric
Value
Price
$0.7002
24h range
$0.6926 to $0.7017
Market cap
$1.755B
FDV
$5.447B
24h trading volume
$60.209M
Perps open interest
$457.659M
Circulating supply
2.508B ASTER
Source: CoinGecko market data, captured November 2, 2026, 11:00 UTC
FDV, or fully diluted valuation, shows what total supply would be worth at today's price.
Aster Buyback and Burn Update: What Changed
A buyback and burn means a project buys its own token, then destroys it.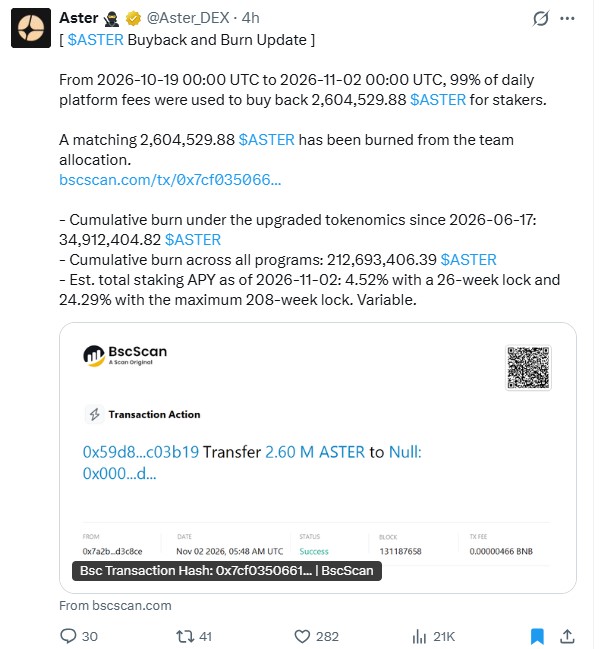
Source: official Aster X post, captured November 2, 2026, 11:00 UTC
Per theofficial Aster X post, 99% of daily platform fees were bought back as 2,604,529.88 ASTER. The window ran from Oct 19, 2026 to Nov 2, 2026, and a matching amount was burned from the team allocation.
If fee volume holds, the next update should show a similar buyback. But if trading fees fall, the buyback shrinks with them.
Source: CoinGlass, captured Nov 2, 2026, 11:00 UTC
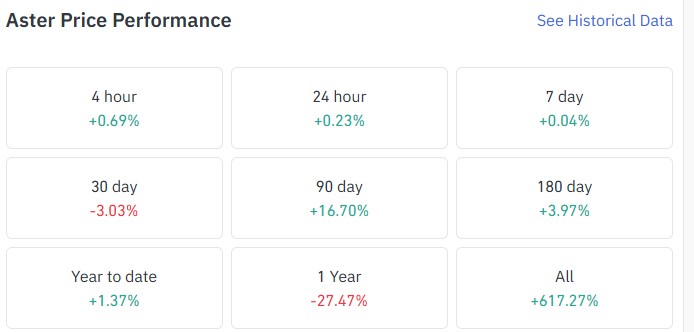
The panel from CoinGlass shows +0.23% over 24h and +0.04% over 7 days. But the 30-day change of -3.03% implies about $0.7214 a month ago, which is $0.0218 above today's price. And one year sits at -27.47%.
Aster Holder Concentration: Who Controls Supply?
The holder's overview, captured Nov 2, 2026, 11:00 UTC, shows extreme Aster holder concentration. The top 100 wallets hold 98.11% of supply, and whales hold 98.88% of market cap.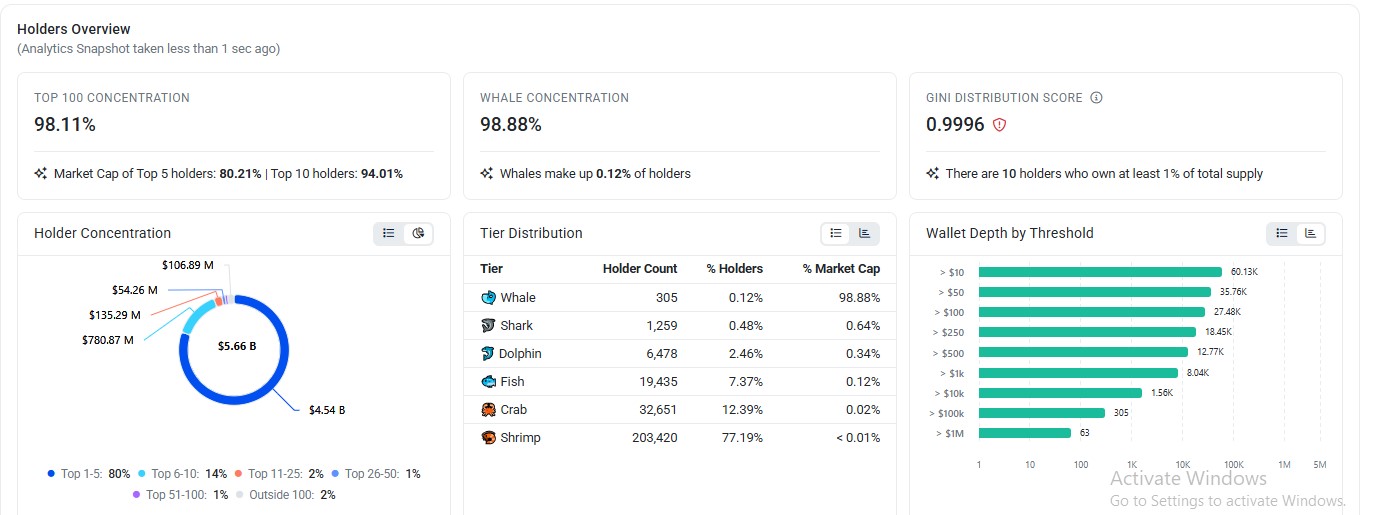
Source: BscScan holder analytics, captured November 2, 2026, 11:00 UTC
The Gini score, a 0 to 1 gauge where 1 means one holder owns everything, reads 0.9996. The top 10 holders control 94.01%, and theBscScan holder list confirms ten wallets above 1% of supply.
Aster Whale Wallets: Top Holders on BscScan
The BSCScan top holders list, captured Nov 2, 2026, 11:00 UTC, puts one unlabeled wallet at 36.4655% of supply.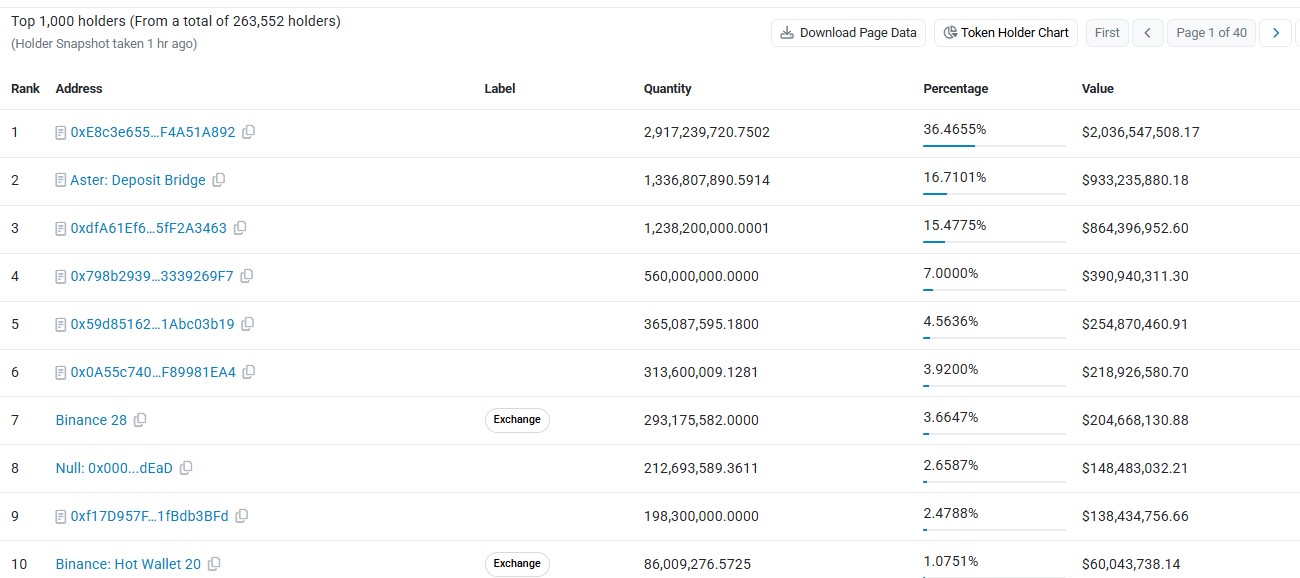
Source: BscScan top holders list, captured November 2, 2026, 11:00 UTC
Aster's Deposit Bridge ranks second at 16.7101%, and Binance 28 holds 3.6647%. The null address, the burn destination, holds 212,693,589.36 ASTER.
TheBscScan burn transaction shows a transfer from a wallet starting 0x59d8 and ending c03b19. The fifth-ranked holder shares both ends.
Aster Open Interest and Futures Volume
Open interest is the total value of futures contracts still open. Aster open interest stands at $457.659M per CoinGecko data at 11:00 UTC on Nov 2, 2026, and the heatmap comes fromCoinGlass derivatives data.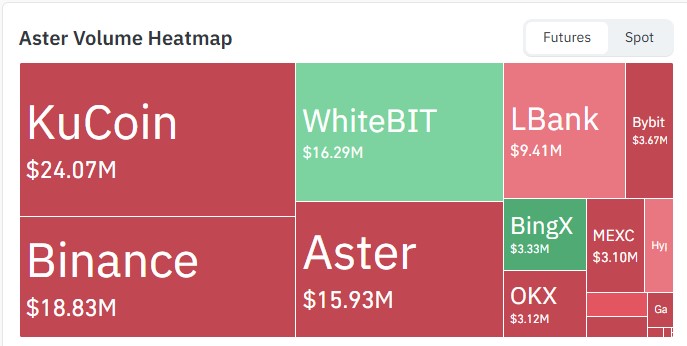
Source: CoinGlass, captured Nov 2, 2026, 11:00 UTC
On futures volume, KuCoin ranks first at $24.07M, ahead of Binance at $18.83M, a $5.24M gap. Aster's own venue ranks fourth at $15.93M.
Aster Technical Analysis: 50-Day EMA and RSI
The Binance 1D chart for ASTER/USDT on TradingView, captured Nov 2, 2026, 11:00 UTC, frames this Aster price prediction. A sharp September rally spiked to the $0.8726 level before sellers took control.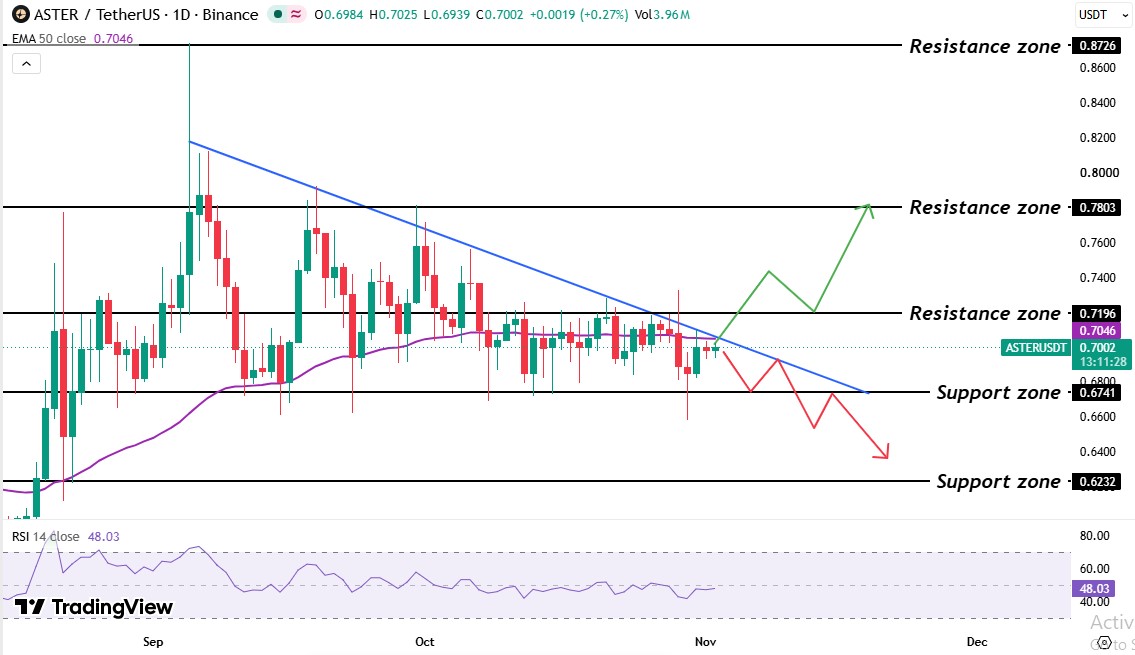
Source: TradingView, ASTER/USDT 1D, EMA 50, and RSI 14, Nov 2, 2026, 11:00 UTC
After the price started going downward and took support from the 50 EMA. A falling trendline, a line joining those highs, now caps ASTER price action.
October trading stayed between the $0.6741 support zone, where buyers have stepped in, and the $0.7196 50 EMA, where sellers have.
Then a late-October price spike above the $0.7196 level, but the sellers defended that falling trendline.For the prior setup, see theAster consolidation breakout test.
The 50-day EMA sits at $0.7046, and ASTER's $0.7002 price trades 0.71% below it. The 14-day RSI reads 48.03. Readings under 50 give sellers a slight edge.
Aster Support and Resistance Levels
Level
Type
$0.8726
Resistance
$0.7803
Resistance
$0.7196
Resistance
$0.7046
50-day EMA
$0.6741
Support
$0.6232
Support
Nearest Aster resistance levels sit at $0.7196 and $0.7803. Aster support levels sit at $0.6741 and $0.6232.
Aster Bull, Base and Bear Scenarios
Scenario
Trigger
Target
Invalidation
Bull
Daily candle trades above $0.7196
$0.7803
Back below $0.7196
Base
Daily candles trade between $0.6741 and $0.7196
$0.7046
Outside either edge
Bear
Daily candle trades below $0.6741
$0.6232
Above $0.7196
Aster Price Prediction: Expert Outlook
As per CoinGabbar analysis, the price has a bearish lean. RSI at 48.03 and a falling trendline favor sellers on rallies, while the fee-funded buyback gives dips a recurring buyer. This Aster price prediction stays range-bound until a daily candle trades above $0.7196.
The next burn update is the checkpoint. If the buyback holds near 2.60M ASTER while a daily candle trades above $0.6741, dip buyers are defending the range.
Disclaimer: This article is for information only and isn't financial advice. Traders should do their own research and risk only what they can afford to lose.