The NFT market entered Q4 2026 in a structurally different position than the 2021–2022 cycle peaks. Total NFT trading volume across major markets is estimated at $2.1–2.4 billion in Q3 2026 —
The NFT market entered Q4 2026 in a structurally different position than the 2021–2022 cycle peaks. Total NFT trading volume across major markets is estimated at $2.1–2.4 billion in Q3 2026 — down significantly from cycle highs but substantially higher than the trough period of early 2023.
The current market is narrower: liquidity is concentrated in fewer collections, and the collections that have retained floor prices have mostly demonstrated either brand utility, strong community development, or both.
This article reviews where the most-watched collections stand as of late October 2026, with floor price estimates, volume trends, and an explicit risk table for anyone evaluating these assets.
NFT Market Context Entering Q4 2026
Several structural shifts define the Q4 2026 NFT market relative to earlier periods.
Multi-chain NFTs are now normalized. In 2021–2022, the NFT market was almost entirely Ethereum-native. By late 2026, Solana accounts for an estimated 15–20% of NFT trading volume, Bitcoin Ordinals have established a distinct collector base, and Base (Coinbase's L2) has emerged as an active minting destination. This chain fragmentation has split liquidity but also broadened the total market.
Blur and OpenSea co-dominate. Blur's pro-trader interface and fee incentives captured a large share of volume from OpenSea starting in 2023. By Q3 2026, Blur handles approximately 40–45% of Ethereum NFT volume and OpenSea approximately 30–35%, with the remainder split across Magic Eden (cross-chain), Reservoir-powered aggregators, and chain-specific platforms.
Royalties remain contested. Creator royalties on secondary sales are not enforced at the protocol level on most platforms. Blur and some Magic Eden listings default to optional or zero royalties. Collections that have built sustainable royalty revenue typically do so through allowlist enforcement or Manifold-based contract controls.
Narrative cycles affect collection attention. In Q4 2026, the dominant NFT narratives center on: (1) collections with real-world brand licensing, (2) NFTs embedded in gaming economies with verifiable on-chain utility, and (3) Bitcoin Ordinals collections benefiting from Bitcoin's continued institutional accumulation cycle.
Blue Chip Collections: Floor Price and Volume Update
"Blue chip" in NFT context refers to collections with established secondary markets, long price history, and significant cultural or brand recognition. Floor price data below is estimated from OpenSea and Blur as of late October 2026.
Collection
Chain
Floor Price (est.)
7-Day Volume (est.)
Supply
CryptoPunks
Ethereum
~52 ETH
~$4.2M
10,000
Bored Ape Yacht Club
Ethereum
~14 ETH
~$3.8M
10,000
Pudgy Penguins
Ethereum
~18 ETH
~$5.1M
8,888
Azuki
Ethereum
~9 ETH
~$2.6M
10,000
Mutant Ape Yacht Club
Ethereum
~3.2 ETH
~$1.4M
~19,000
Milady Maker
Ethereum
~4.8 ETH
~$1.9M
9,999
All figures are estimates from aggregated data as of late October 2026. Floor prices fluctuate significantly; verify current data before any purchase decision.
CryptoPunks maintain the highest per-unit floor among major collections, supported by a combination of historical significance and Yuga Labs stewardship. Volume is relatively low given supply, reflecting high hold rates among current owners.
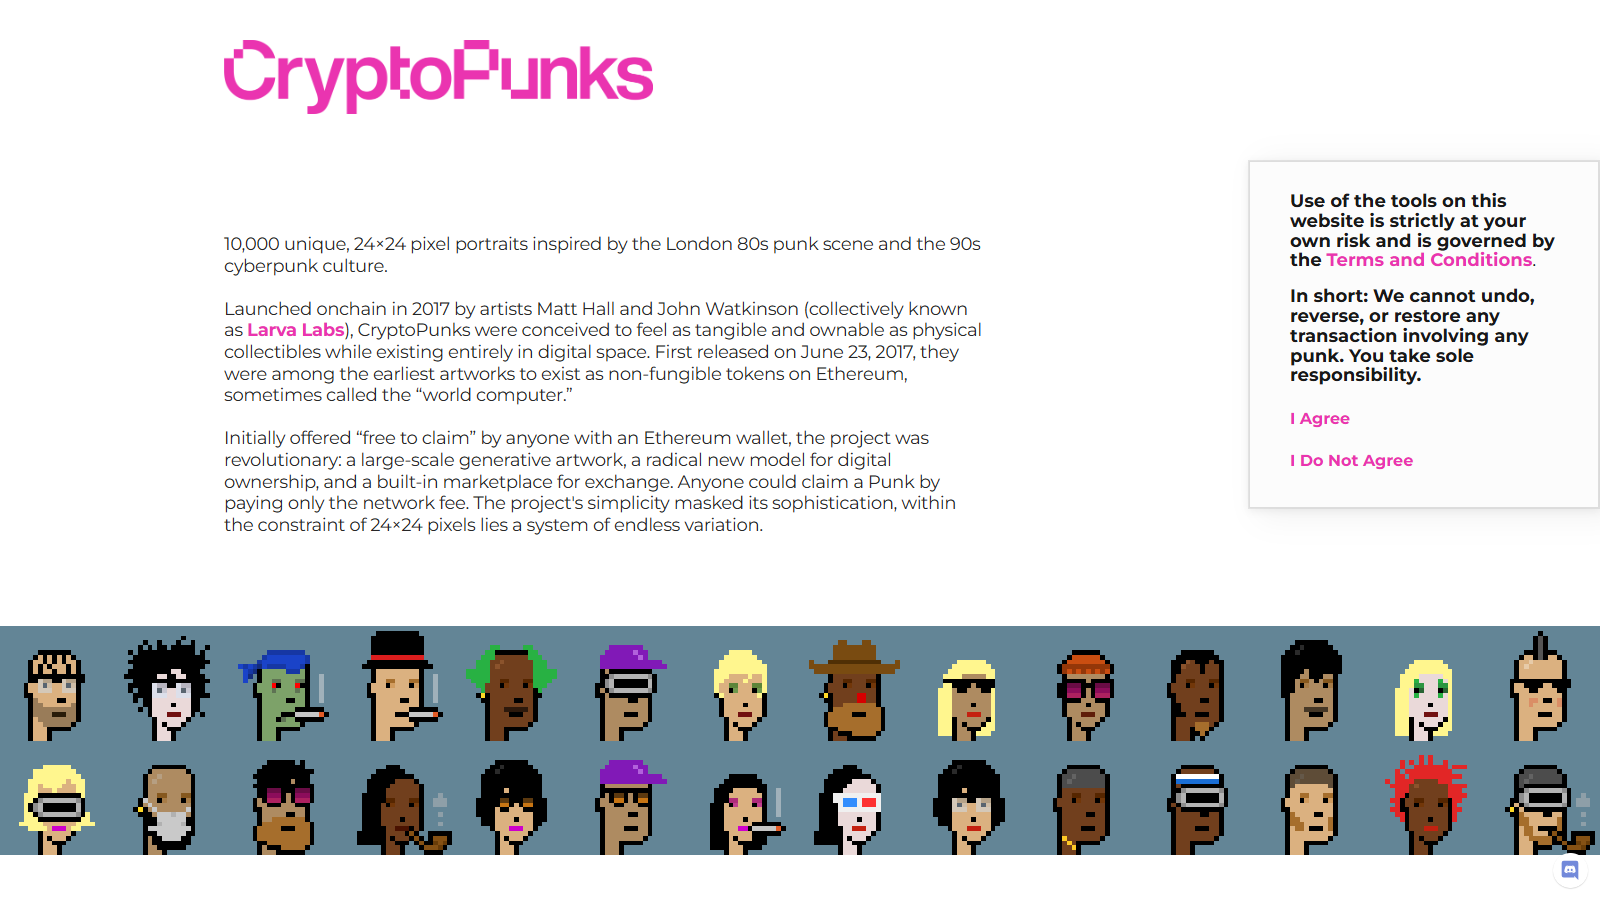
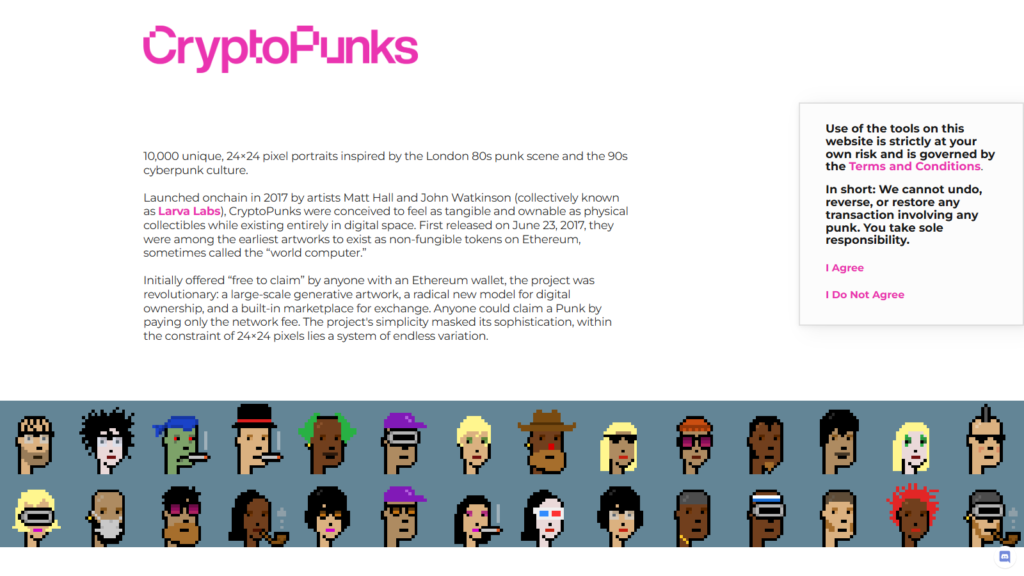 CryptoPunks' official website presents the collection's 10,000 pixel portraits and on-chain history. Image source: CryptoPunks.
Pudgy Penguins has outperformed most of the peer group over the past 12 months. The Pudgy Toys physical merchandise program, active since 2023, contributed to brand recognition outside crypto-native audiences. Floor price has held above 15 ETH for most of 2026.
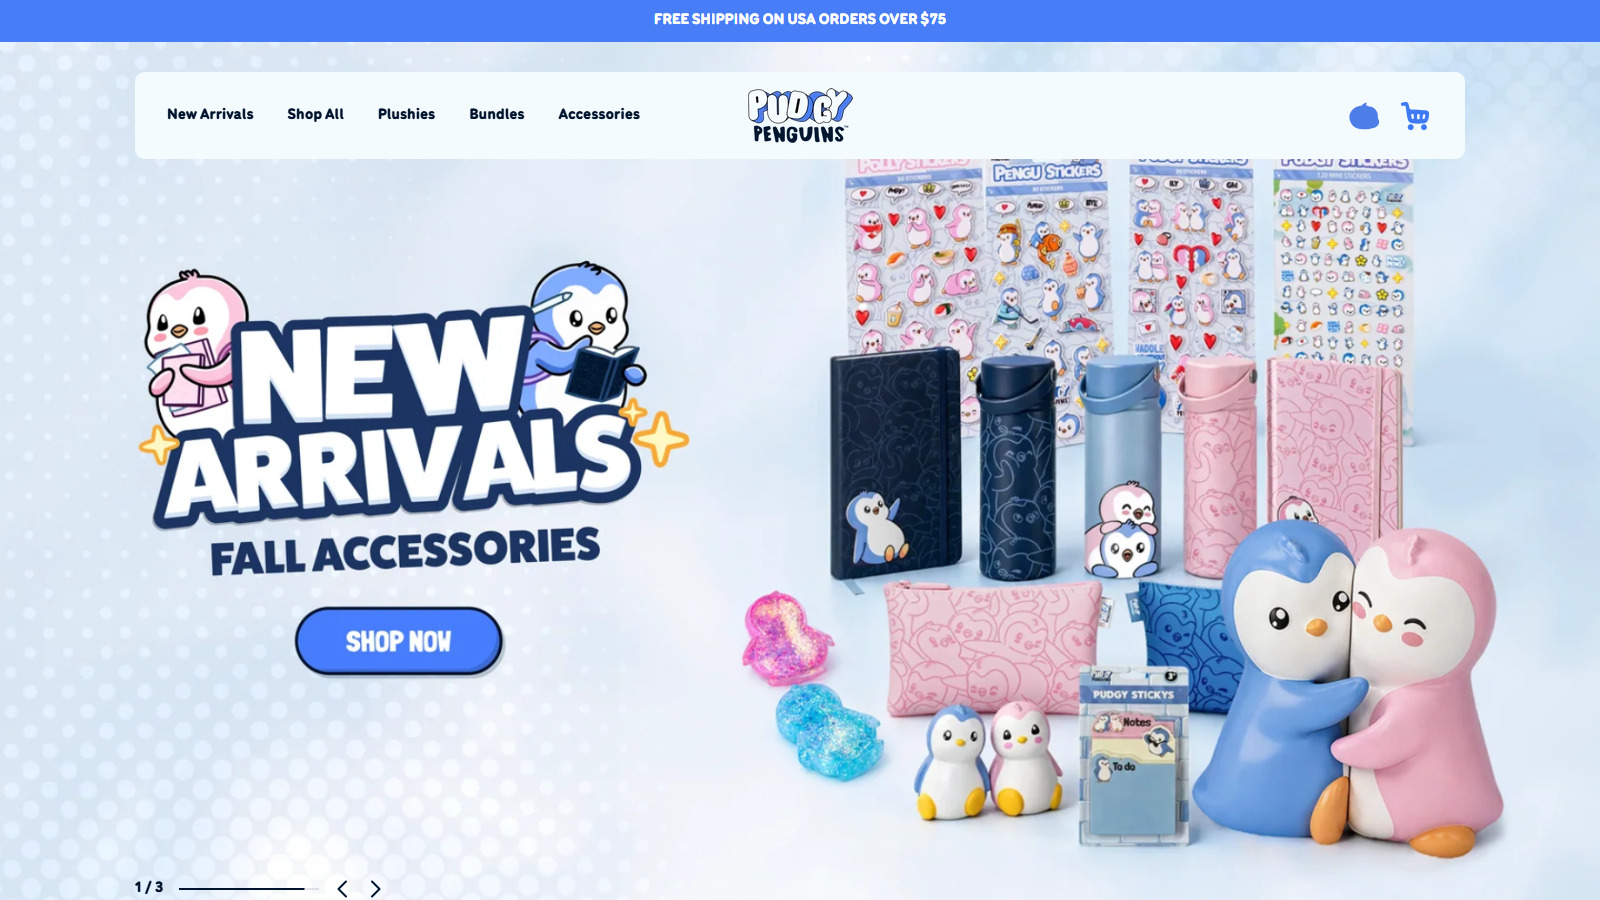
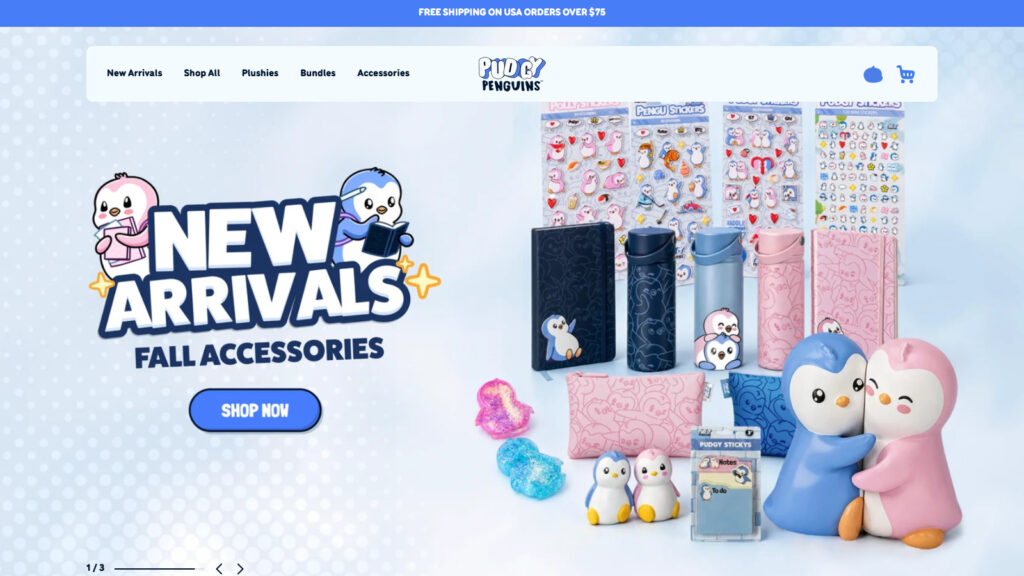 The official Pudgy Penguins store illustrates how the NFT brand extends into physical merchandise. Image source: Pudgy Penguins.
BAYC floor compressed significantly from its 2021–2022 highs. The Yuga Labs ecosystem (MAYC, Otherside land, ApeCoin) remains active but has not recovered peak valuations. Volume is consistent rather than speculative-spike driven.
Emerging Collections With Organic Traction
Several newer collections have built meaningful secondary markets in 2026 without relying on celebrity endorsement or large centralized marketing budgets. The clearest indicator of organic traction is consistent weekly volume without promotional events driving spikes.
Base-native collections. The Base chain has a growing collector base driven by lower gas costs — typically under $0.05 per transaction. Collections native to Base that have established floor markets include several pixel-art and profile-picture projects with 5,000–10,000 supply.
Floor prices are low in ETH terms ($30–150 range) but trade volume is active. Base collections are speculative — many will not maintain liquidity — but the chain's growing wallet base provides a larger audience than most new Ethereum-native projects.
Bitcoin Ordinals — top collections. The Ordinals protocol, which allows inscribing data directly onto individual satoshis on Bitcoin, has produced a small number of collections with sustained value. NodeMonkes and Bitmap are among the best-known, with active secondary markets on Ordinals-native platforms. Bitcoin Ordinals trade differently from EVM-based NFTs — settlement is slower, custody is more complex — but collector demand from Bitcoin-native holders has been consistent.
Abstract ecosystem NFTs. The Abstract chain launched its mainnet in early 2026 with a consumer-focused product approach. Abstract ecosystem NFTs — particularly projects launched with native Abstract wallet integration — have attracted attention as a new liquidity destination. The ecosystem is early enough that most collections remain speculative, but onboarding friction is lower than early Ethereum NFT cycles.
Gaming and Utility NFTs Gaining Ground
The 2021–2022 NFT cycle included many "play-to-earn" projects that failed due to unsustainable token economics. The surviving gaming NFT category in 2026 looks different: it is smaller, more selective, and the projects that have retained value generally have functioning games with player-owned economies rather than speculative token pyramids.
Illuvium assets (Ethereum / Immutable X). Illuvium's full game launched in 2024 and is in active development in 2026. The game's NFT assets — Illuvials (collectible creatures), land parcels, and equipment — have established secondary markets. The connection between in-game utility and asset value is more direct than most NFT projects claim but do not deliver.
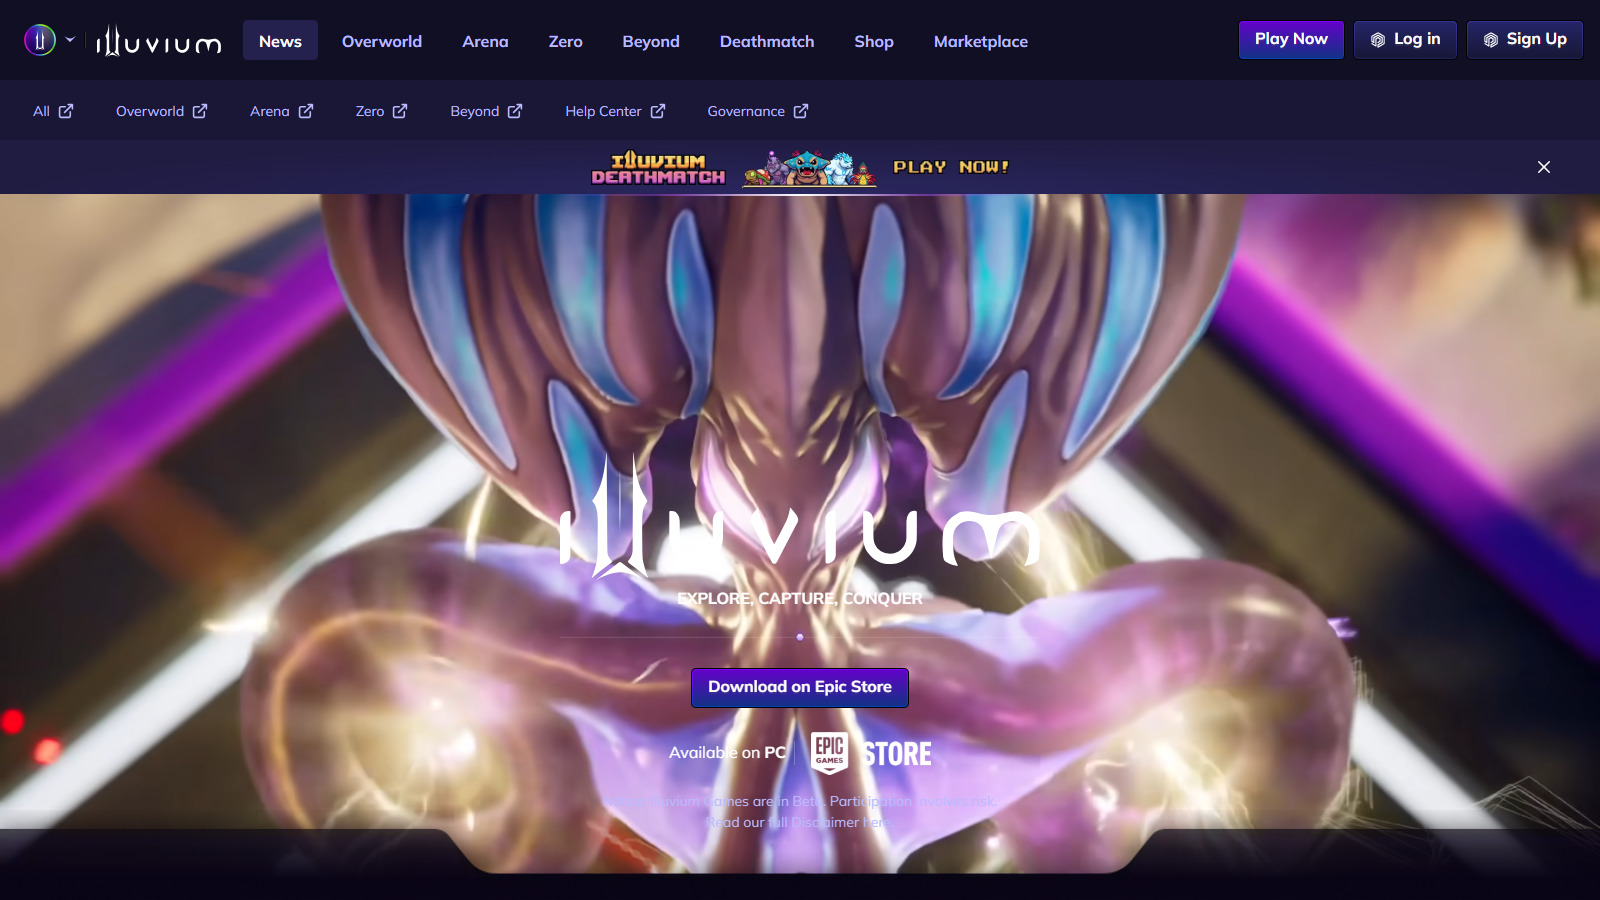
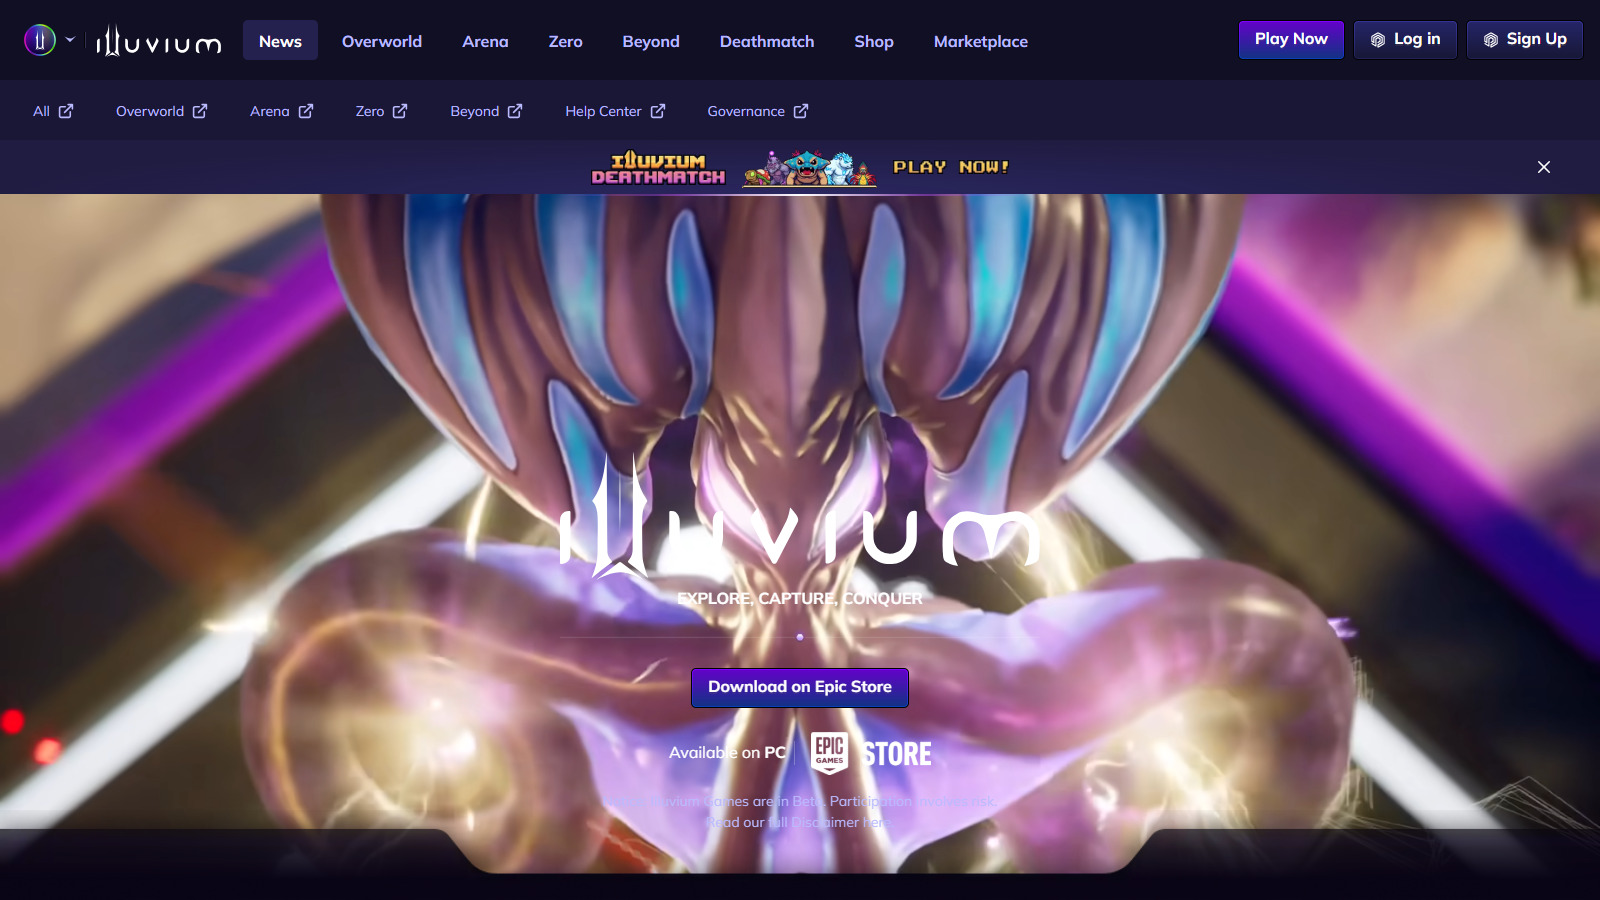
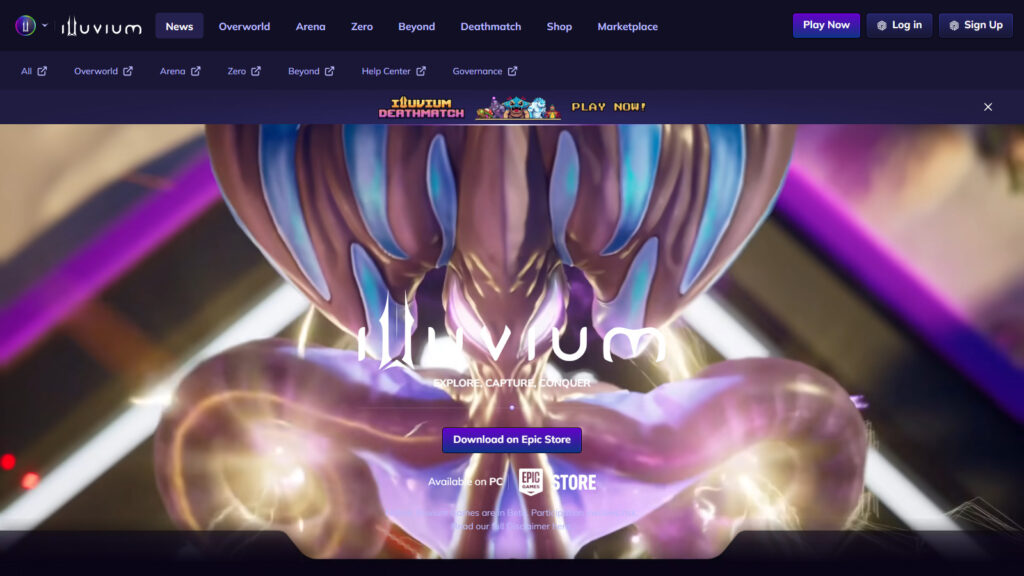 Illuvium's official website highlights the playable game environment behind its NFT assets. Image source: Illuvium.
Ronin ecosystem. Axie Infinity's Ronin chain has expanded beyond Axie to host multiple NFT-based games. Total Ronin NFT volume declined significantly from the 2021 peak but has stabilized around a core player base. New Ronin games launched in 2025–2026 have introduced new NFT asset categories with clearer utility loops.
Decentraland and The Sandbox land. Virtual land in these metaverse platforms has not recovered to 2021–2022 valuations. Active user counts remain modest compared to early projections. These assets are best categorized as speculative with long-term uncertainty rather than established-value holds.
What separates utility NFTs that hold value: The collections that have maintained floor prices in the gaming and utility category share a common pattern — there is a product actually being used (a game with active players, a platform with demonstrable traffic), not just a roadmap. Verify on-chain active user counts before treating utility NFTs as anything other than speculation with a utility narrative.
Risk Table: Liquidity, Project Longevity, Chain Risk
Evaluating NFT collections requires looking at multiple risk dimensions simultaneously. Floor price and volume alone do not capture the full picture.
Collection / Category
Liquidity Risk
Project Longevity Risk
Chain Risk
Overall Risk
CryptoPunks
Low (deep market)
Very Low (established)
Low (Ethereum)
Low
Pudgy Penguins
Low–Medium
Low (brand expansion active)
Low (Ethereum)
Low–Medium
BAYC / MAYC
Low (market exists)
Medium (ecosystem direction unclear)
Low (Ethereum)
Medium
Azuki
Medium
Medium (roadmap active)
Low (Ethereum)
Medium
Base-native collections
High (thin markets)
High (unproven)
Low–Medium (Base)
High
Bitcoin Ordinals (top collections)
Medium–High (custody complexity)
Medium
Very Low (Bitcoin)
Medium–High
Gaming NFTs (Illuvium)
Medium
Medium (game active)
Low (Immutable X)
Medium
Metaverse land (Decentraland, Sandbox)
High (illiquid floor)
High
Low (Ethereum)
High
Liquidity risk is the risk that you cannot exit at a reasonable price when you want to sell. Thin order books and wide bid-ask spreads indicate high liquidity risk. Check current bids on Blur, not just the floor listing price.
Project longevity risk reflects the probability that the team, brand, or product continues to operate meaningfully over the next 3–5 years. Projects with clear revenue — royalties, licensing, active user spending — score lower on this dimension.
Chain risk is relatively low across established chains but includes smart contract risk, bridge risk for cross-chain assets, and the custody model specific to each chain. Bitcoin Ordinals custody is notably different from EVM wallets and carries its own UTXO management complexity.
FAQ
What are the best NFT collections to buy in Q4 2026?
There is no universal answer. Collections with the lowest risk profiles based on liquidity and project longevity include CryptoPunks and Pudgy Penguins, but both carry significant floor prices. Lower-priced alternatives with active communities include Azuki and select Base-native collections, with correspondingly higher risk. Define your risk tolerance and time horizon before any purchase.
Is the NFT market recovering in 2026?
It is more accurate to say the market has stabilized and narrowed rather than "recovered" in the sense of returning to 2021–2022 volume levels. Total volume is well below peak but above the 2023 trough. A smaller number of collections now hold the majority of liquidity and collector attention.
What is floor price in NFTs?
Floor price is the lowest listed price for any item in a collection on secondary markets. It is the cheapest entry point to hold a piece from that collection. Floor prices change constantly and do not reflect average sale price or the price for rare traits — a collection's average sale price is typically 2–5× its floor.
Are Bitcoin Ordinals worth buying in Q4 2026?
Bitcoin Ordinals have a distinct collector base and genuine on-chain permanence — inscribed directly on Bitcoin. The main friction is custody complexity: managing Ordinals requires an Ordinals-aware wallet and an understanding of UTXO management. Top Ordinals collections represent a different risk and liquidity profile than EVM-based NFTs. That complexity is a real barrier for new buyers.
How do I track NFT floor prices in real time?
OpenSea, Blur, and Magic Eden show live floor prices for their listed collections. Aggregators like NFTGo and Icy.tools provide cross-platform floor data with historical charts. For Ordinals, dedicated platforms like Ordinals Wallet or Magic Eden's Ordinals section show current listings.
What is the difference between a blue chip NFT and an emerging collection?
Blue chip refers to collections with long price history, large secondary markets, and established cultural recognition — CryptoPunks, BAYC, Pudgy Penguins. Emerging collections have shorter histories and thinner markets. The tradeoff is straightforward: lower entry cost with higher probability of losing liquidity entirely.
Disclaimer: This article is for informational purposes only and does not constitute financial or investment advice. Cryptocurrency and digital asset markets carry significant risk. Always do your own research before making decisions.
Read original article on nftenex.com