


Bitcoin Drops Sharply as US-Iran Peace Talks Collapse – But These 2 Charts Say “Buy the Dip”
 BTC
BTC
Key Highlights
- Bitcoin (BTC) drops over 1.5% in the last 24 hours to around $71,600 after US-Iran peace talks in Islamabad collapsed following a 21-hour negotiation session.
- The failure of the talks erased recent weekend gains that had pushed BTC close to $73,500 on ceasefire optimism.
- Top analysts highlight strong long-term setups, suggesting the current dip may be a “buy the dip” opportunity rather than the start of a bear market.
- Major support identified at $60,000 (Parabolic Guard zone), while next key resistance stands at $76,000.
Bitcoin (BTC) is feeling the heat of fresh geopolitical uncertainty. On Sunday, April 12, 2026, the cryptocurrency dropped more than 1.5% in 24 hours, sliding from near $73,700 levels to around $71,600 as high-stakes US-Iran peace talks in Islamabad collapsed after a marathon 21-hour session.
 Bitcoin (BTC) Price/Source:: Coinmarketcap
The failure erased much of the weekend relief rally that followed the initial two-week ceasefire announcement. Vice President JD Vance, leading the US delegation, stated that Iran refused to accept key US terms — particularly on its nuclear program and regional security issues. Iran, in turn, described the demands as excessive. With no agreement reached, risk assets including Bitcoin quickly repriced for potential renewed tensions in the Middle East.
Why Bitcoin Dropped Today
- Initial Ceasefire Boost: Earlier optimism around de-escalation pushed BTC toward $73,500+.
- Talks Breakdown: No deal on core issues led to a classic risk-off move. Traders rotated out of high-beta assets like crypto.
- Current Price: As of early Asian trading on April 12, BTC trades near $71,600, down roughly $1,000–$1,500 from recent highs.
While the short-term reaction is negative, many analysts view this as headline-driven volatility rather than a fundamental shift in Bitcoin’s bull cycle.
Two Powerful Charts That Suggest “Buy the Dip”
Even as prices dipped, leading technical voices on X highlighted long-term setups that remain intact.
1. Cycle Bottom Analysis –
Many traders obsess over whether the current range low must be “swept” like in 2022 (FTX black swan). However,
@MaxBecauseBTC points out the small sample size of bear market bottoms:
- 2015: No range low sweep
- 2019: No range low sweep
- 2022: Dramatic sweep due to FTX collapse
- 2026: Still undecided
His multi-panel chart comparison shows that more historical bottoms formed without a full deviation than with one. He advises staying flexible, avoiding recency bias, and “slow playing” the situation rather than forcing aggressive entries. This perspective frames the current dip as potentially part of a normal cycle bottom formation rather than the start of deeper pain.
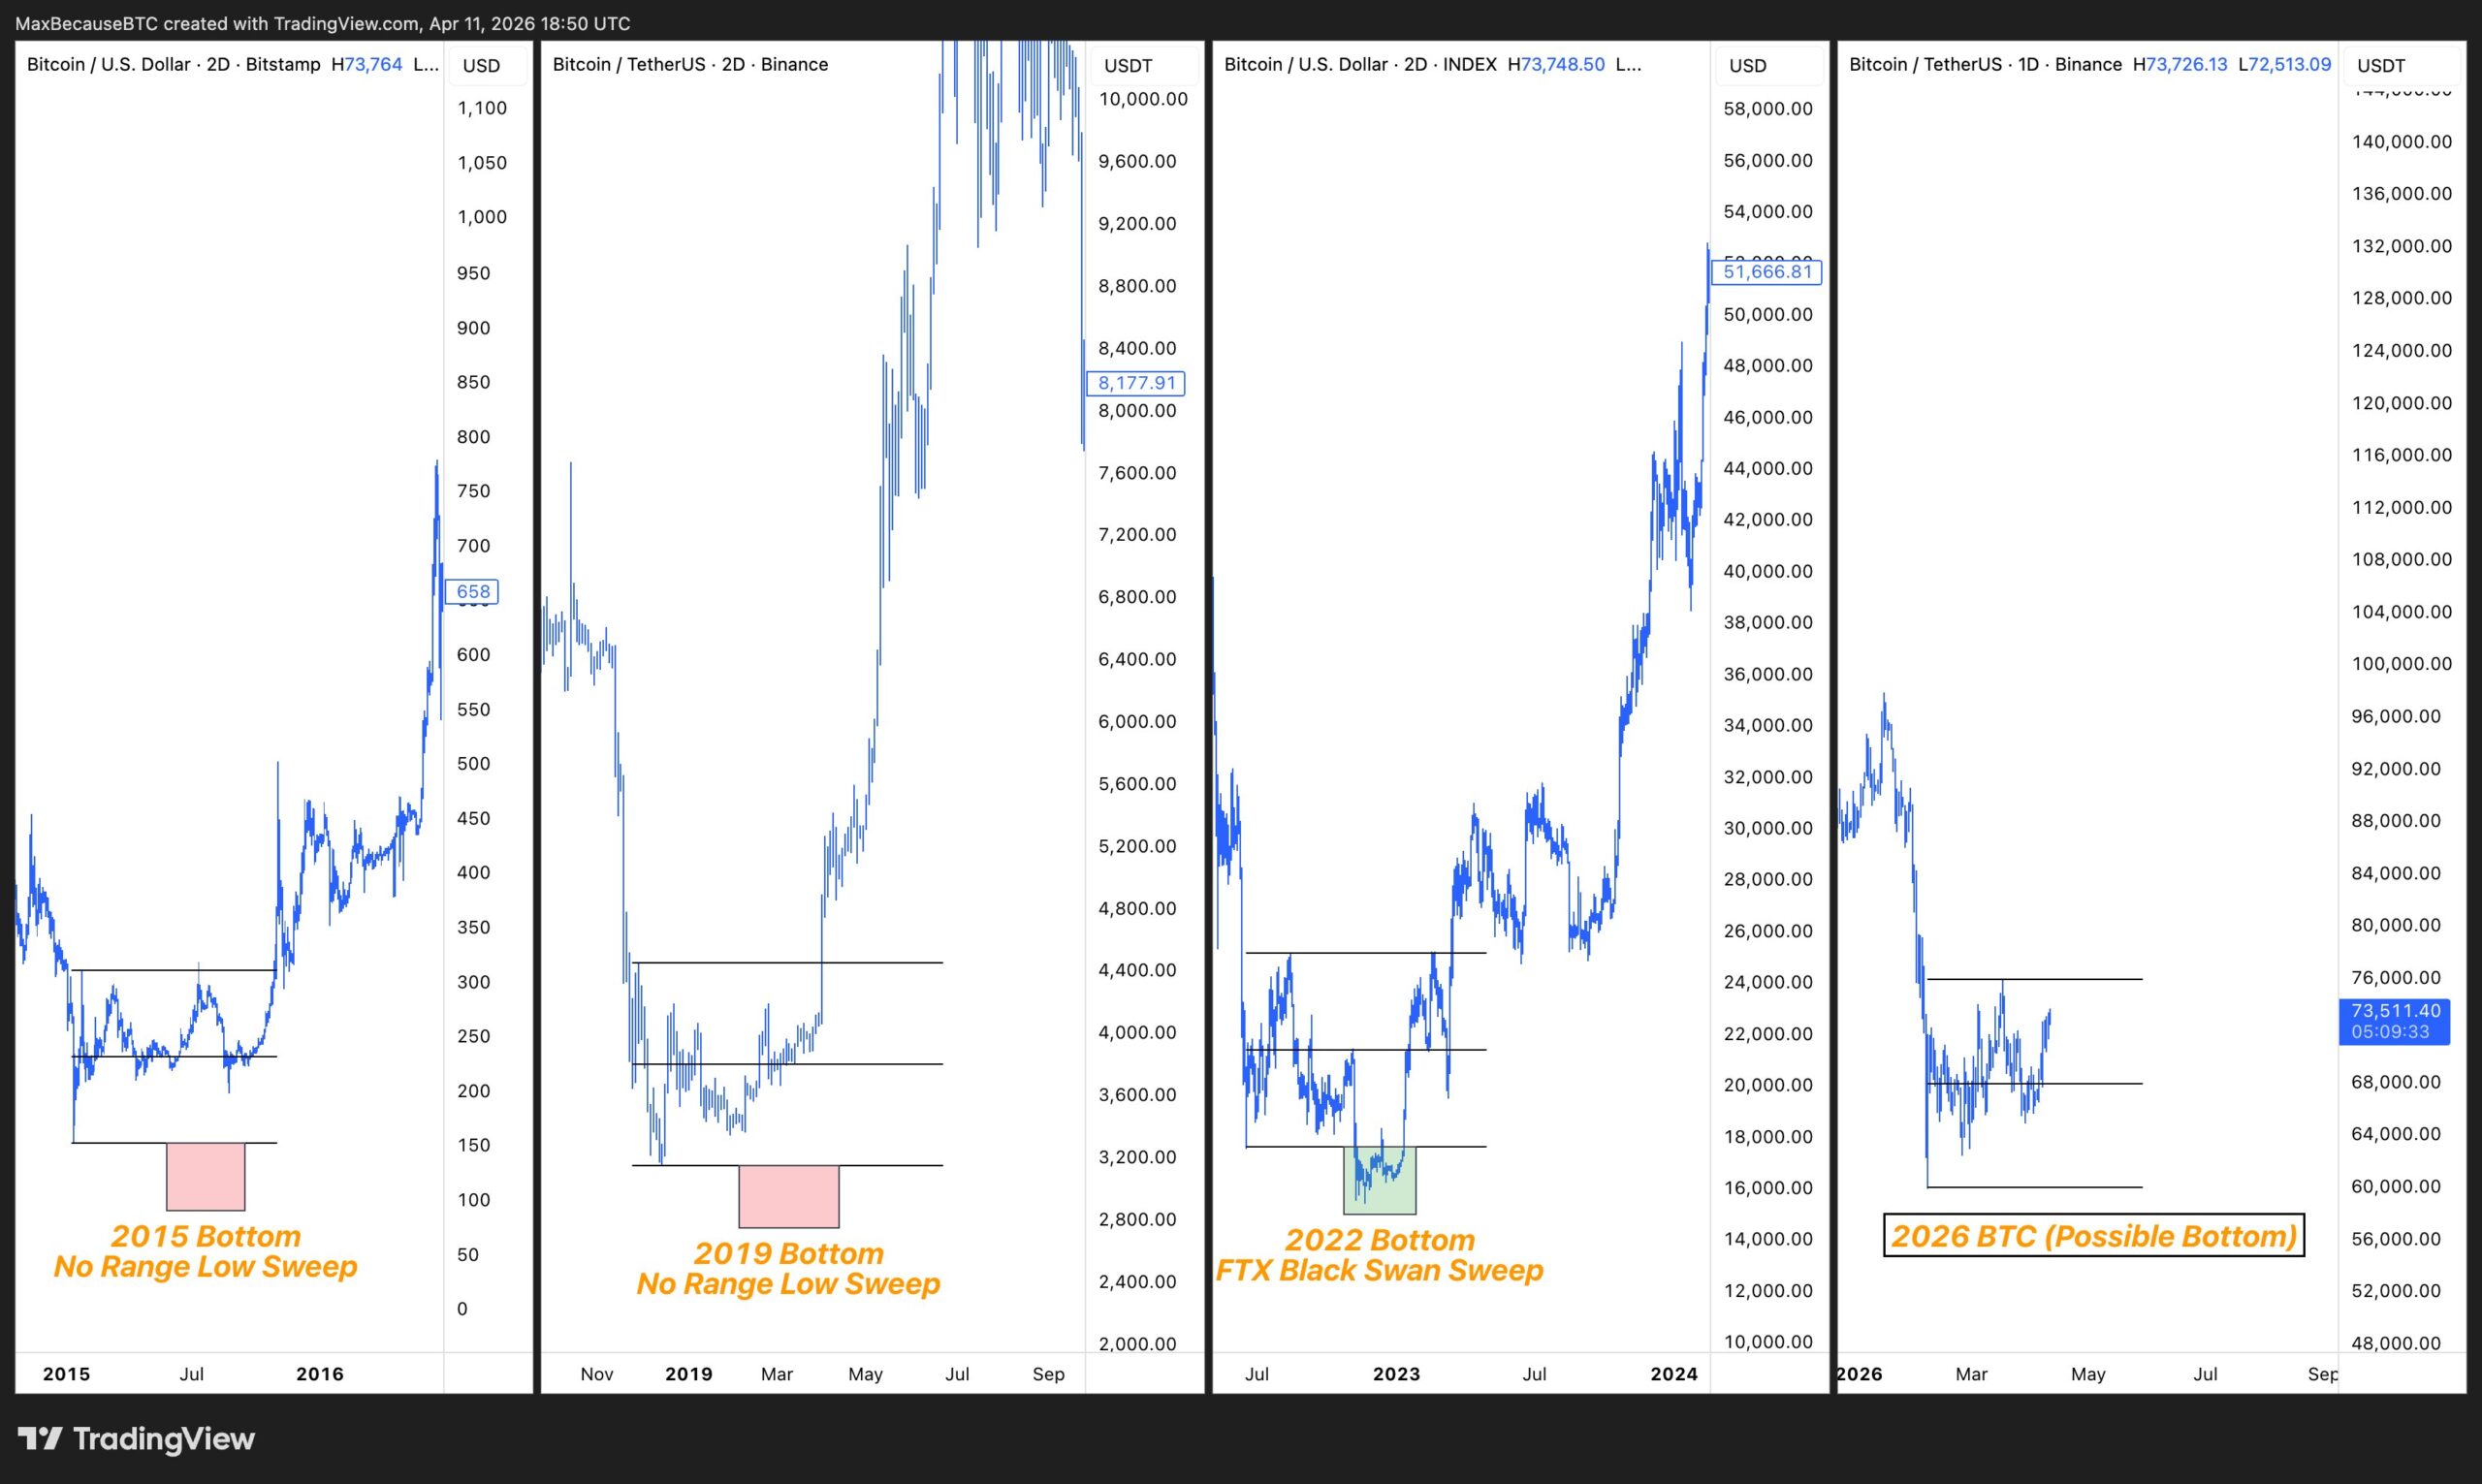 BTC Cycles With Bottoms/Credits: @MaxBecauseBTC (X)
2. The “Parabolic Guard” Trendline –
This is one of Bitcoin’s most respected long-term technical lines — an ascending trendline that has acted as major support for nearly a decade. Every major touch has been followed by explosive rallies:
- 2017: +963%
- 2018: +261%
- 2020: +1,126%
- 2022: +660%
The weekly chart shows Bitcoin approaching this critical zone between $56,000 and $60,000. According to
@alicharts, this is historically where “smart money” completes accumulation before the next major leg higher.
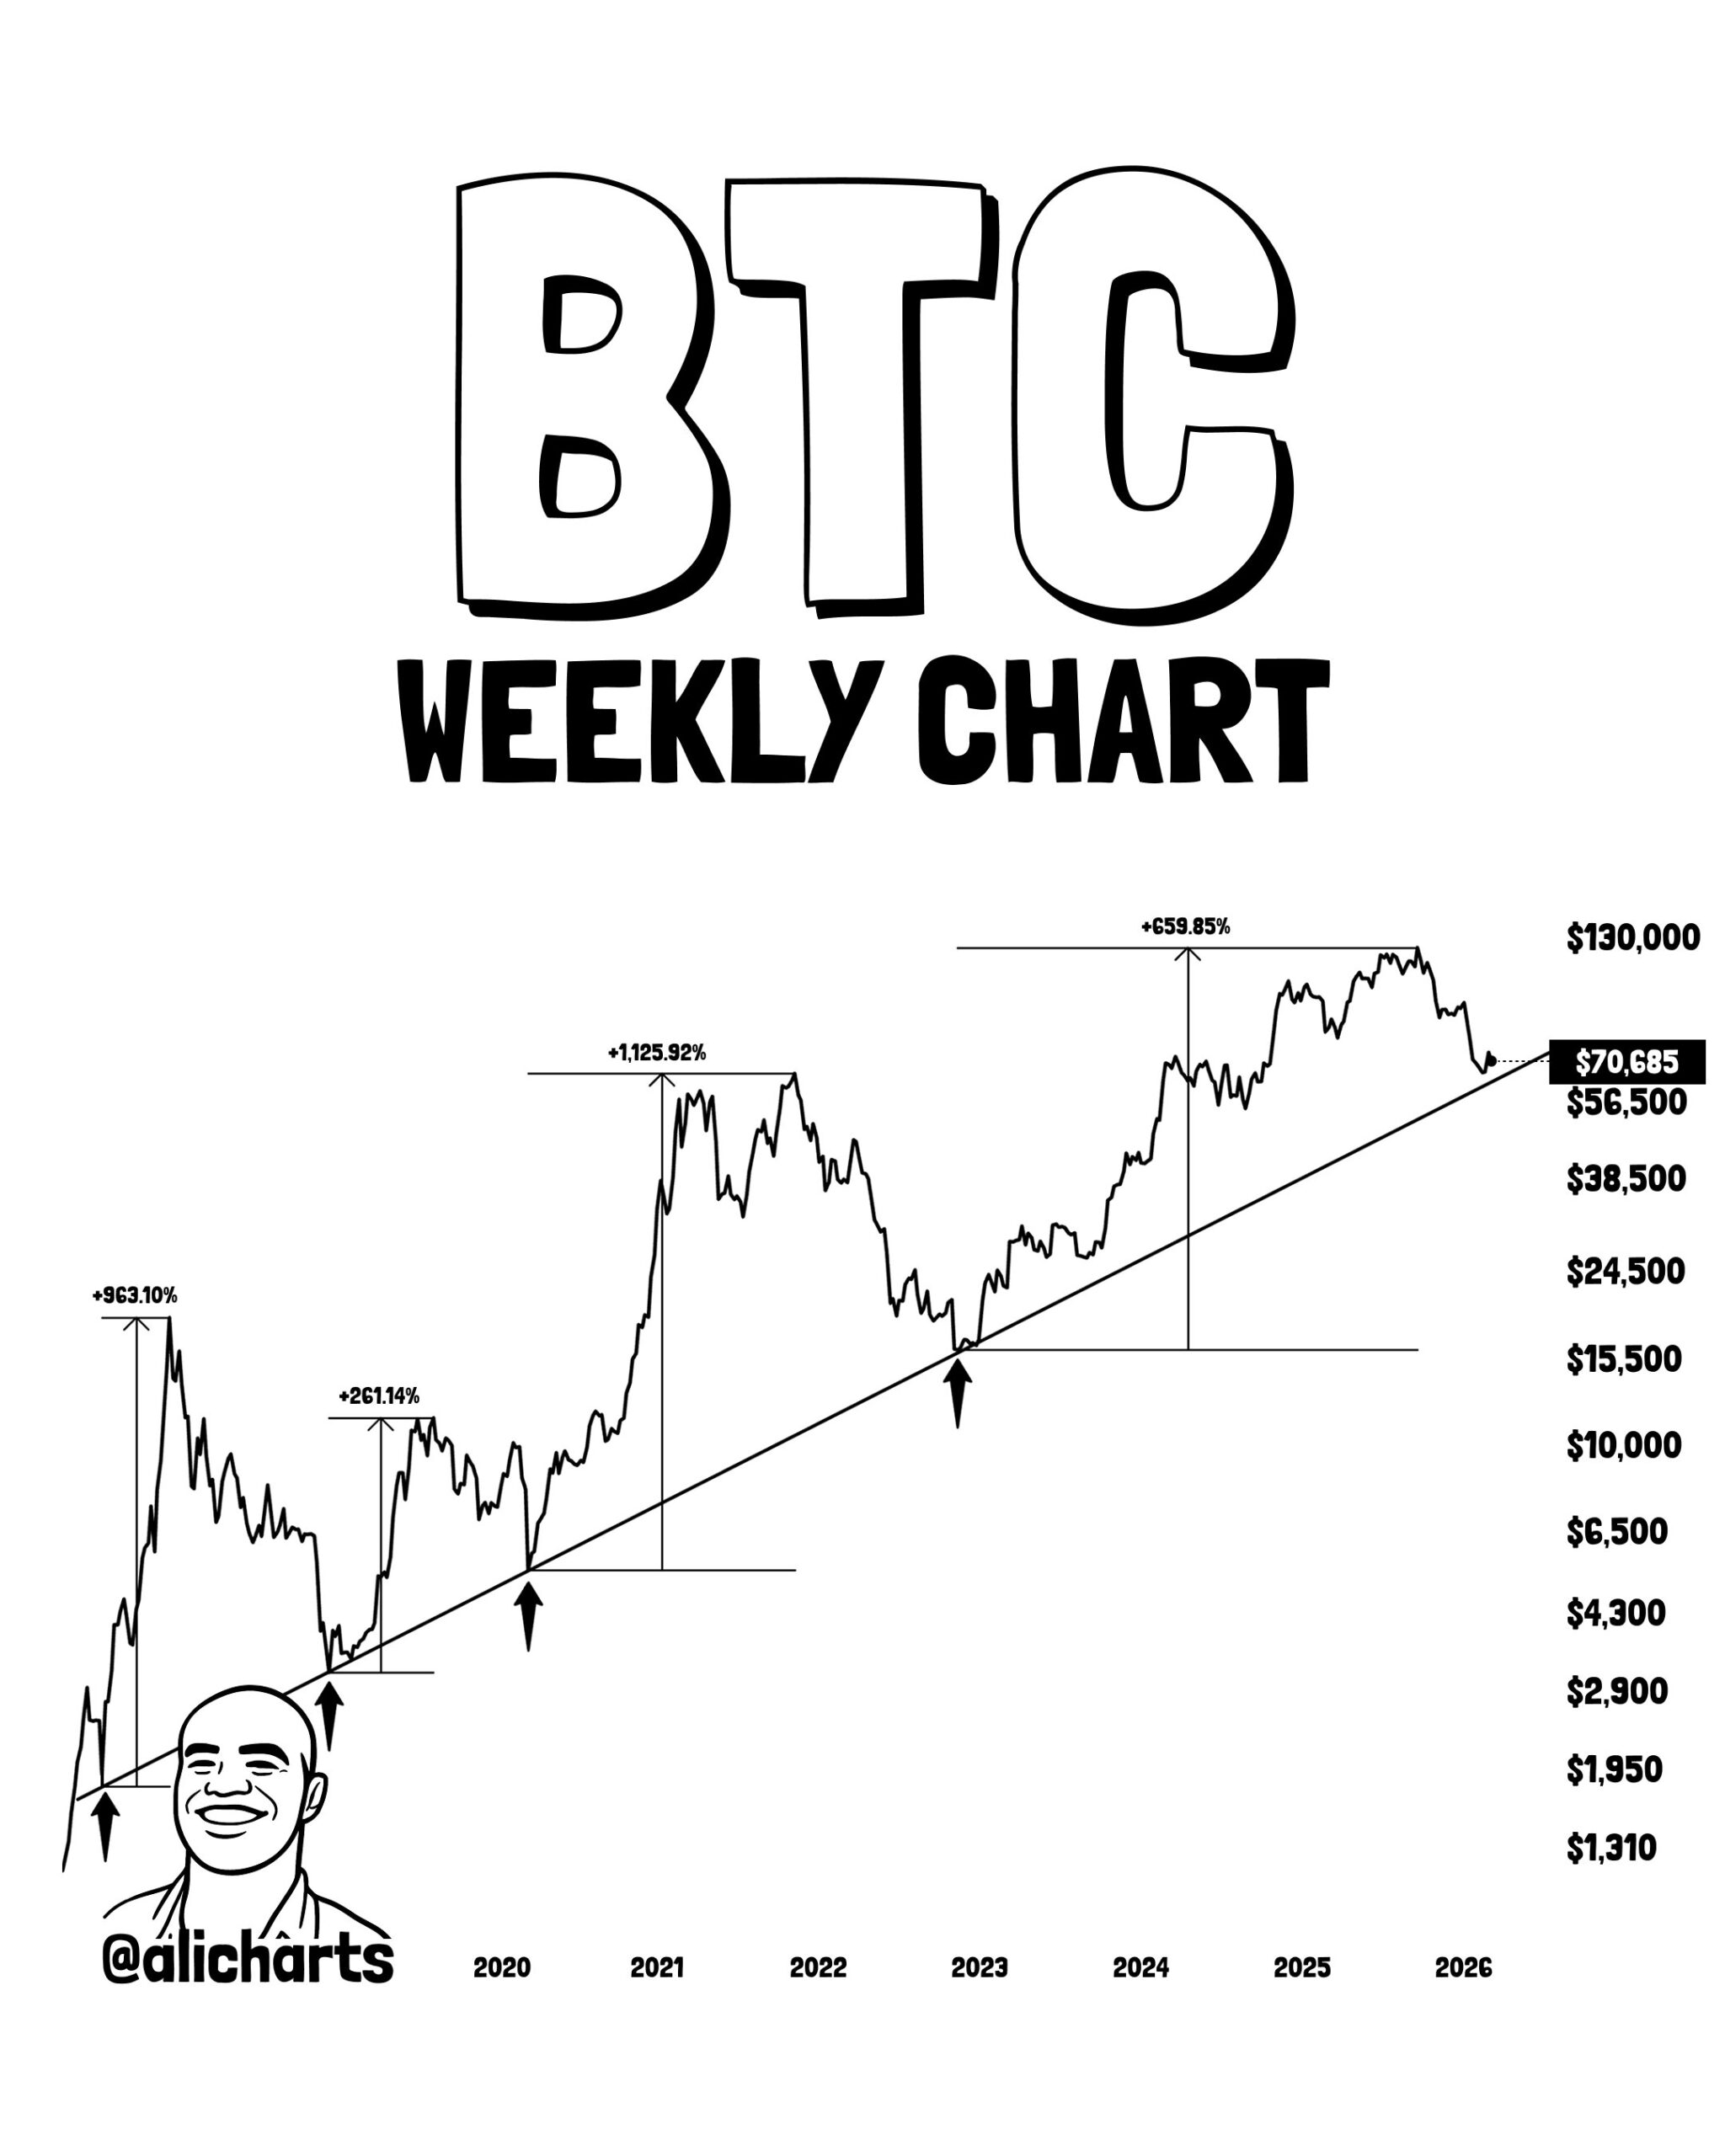 BTC Weekly Chart/Credits: @alicharts (X)
Key Technical Levels to Watch
- Support: $60,000 — Major psychological level and alignment with the Parabolic Guard zone. A hold here would reinforce the bullish long-term setup.
- Resistance: $76,000 — The next significant overhead barrier. Breaking and holding above this could open the door to new all-time highs in the coming months.
Other nearby levels include immediate support near $70,000–$71,000 and resistance around $73,000–$74,000.
What’s Next for Bitcoin?
The collapse of talks reintroduces a geopolitical risk premium, which could keep oil prices elevated and pressure risk assets in the short term. However, core bull-market drivers — institutional adoption, ETF inflows, and post-halving cycle dynamics — remain largely unaffected for long-term holders.
Many in the crypto community see today’s drop as a classic “buy the dip” opportunity, especially with the technical confluence pointing to strong support around the $60K zone.
Bottom Line:
Bitcoin is down sharply today on failed US-Iran peace talks, but the charts from @MaxBecauseBTC and @alicharts tell a more optimistic story. With major support at $60K and resistance at $76K, this dip could prove to be another accumulation window for patient investors.
Volatility is expected while diplomatic developments unfold. Will we see renewed talks or escalation? Either way, history suggests Bitcoin has repeatedly turned geopolitical noise into long-term gains.
Frequently Asked Questions
Why did Bitcoin price drop today?
Bitcoin dropped over 1.5% as high-stakes US-Iran peace talks in Islamabad collapsed without a deal. The failure removed recent de-escalation optimism and triggered a risk-off sentiment across markets.
What is the current Bitcoin price?
As of April 12, 2026, Bitcoin is trading around $71,600, down from recent highs near $73,500.
What are the key support and resistance levels for BTC?
Strong support is at $60,000 (aligned with the Parabolic Guard trendline). Major resistance sits at $76,000. Immediate support is near $70,000–$71,000.
Should I buy the Bitcoin dip?
Many analysts suggest the current dip could be a buying opportunity. Historical cycle analysis and the Parabolic Guard chart indicate $56K–$60K as a potential major accumulation zone for long-term holders.
Disclaimer: The views and analysis presented in this article are for informational purposes only and reflect the author’s perspective, not financial advice. Technical patterns and indicators discussed are subject to market volatility and may or may not yield the anticipated results. Investors are advised to exercise caution, conduct independent research, and make decisions aligned with their individual risk tolerance.
