The crypto market took a step back today. The total market cap fell to $2.76 trillion, down 0.60% in the past 24 hours. Trading volume sits at $94.41 billion. Bitcoin slipped to $78,062.80. E
The crypto market took a step back today. The total market cap fell to $2.76 trillion, down 0.60% in the past 24 hours. Trading volume sits at $94.41 billion.
Bitcoin slipped to $78,062.80. Ethereum eased to $2,470.13. XRP dropped to $1.38. Most coins are red today, but the drop is mild, not a crash.
Why is Crypto Market Down Today?
A mix of politics and economic data is pushing the market lower. President Trump said he will issue a $5,000 "dividend" to every adult citizen in the US if Republicans win the midterm elections.
There are around 245 million US citizens aged 18 and older. That means this plan would cost close to $1.2 trillion. It would be the biggest stimulus payment since the pandemic.
But the bigger driver behind today's dip is inflation worry. Oil prices have climbed, and that is stoking fears of higher inflation. The Fed rate hike probability has now reached 60.40%, based on CME FedWatch-style data shown below.
Separately, Senator Cynthia Lummis is pushing the Senate to pass the CLARITY Act and send it to President Trump's desk. This bill could shape how crypto is regulated in the US going forward.
What is the Fed rate hike probability for September 2026?
Markets are now pricing in a 60.4% chance of a rate hike at the September 16 Fed meeting, up from 39.6% odds of no change.
Target Rate (bps)
Now
1 Day Ago
1 Week Ago
1 Month Ago
350-375 (Current)
39.6%
40.6%
50.6%
47.8%
375-400 (Hike)
60.4%
59.4%
49.4%
52.2%
A month ago, the odds were close to a coin flip. Now, the market thinks a hike is more likely than not. Higher rates usually mean less money flowing into risk assets like crypto.
Is the crypto market in fear or greed right now?
The Fear & Greed Index shows a score of 69 today. That puts the market in Greed territory.
Time
Score
Sentiment
Now
69
Greed
Yesterday
66
Greed
Last Week
65
Greed
Last Month
29
Fear
A month ago, the market was scared, sitting at 29. Since then, sentiment has flipped hard toward greed. That shift can be a warning sign. When too many traders get greedy at once, sharp pullbacks tend to follow.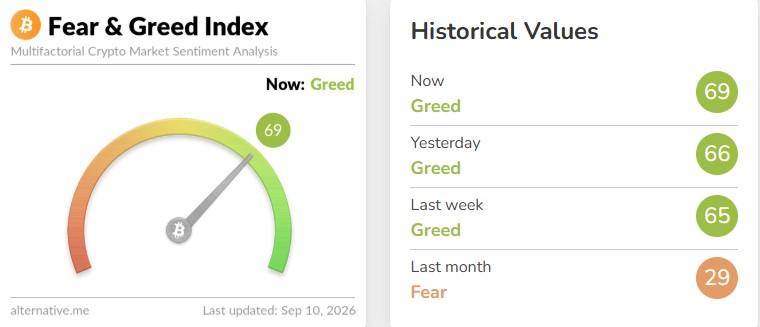
How much crypto got liquidated in the last 24 hours?
Liquidations hit hard today. According to CoinGlass data, 142,778 traders were liquidated in the past 24 hours, with total liquidations reaching $368.46 million.
Long positions took most of the damage. Traders betting on higher prices lost $290.43 million, while short sellers lost just $78.03 million. That tells you most traders were leaning bullish right before the drop.
Here is how the losses stack up across different time windows:
Time Window
Total Liquidated
Longs Lost
Shorts Lost
1 Hour
$5.89M
$5.49M
$401.28K
4 Hour
$17.55M
$13.77M
$3.79M
12 Hour
$164.70M
$142.61M
$22.10M
24 Hour
$368.46M
$290.43M
$78.03M
By coin, here is where the damage was concentrated over the last 24 hours:
Asset
24H Liquidations
Others
$84.82M
Bitcoin (BTC)
$69.00M
Ethereum (ETH)
$51.87M
ZEC
$13.53M
SOL
$13.17M
IOST
$11.75M
XRP
$7.90M
The single biggest liquidation happened on Binance, on the BTCUSDC pair, worth $6.47 million. That kind of size shows how much leverage is still sitting in this market.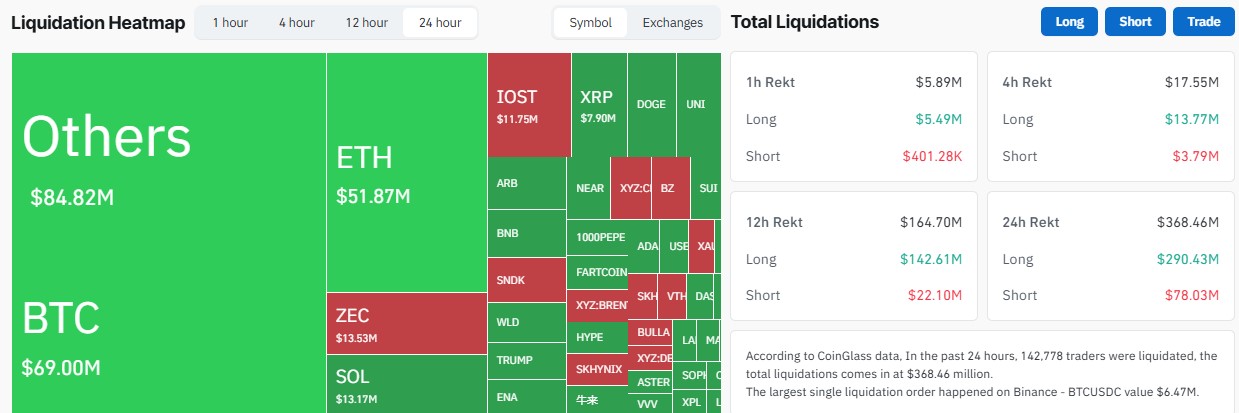
What crypto events are happening this week?
The next ten days are stacked with market-moving events. Here is what is coming and when.
Date
Event
Why It Matters
Sept 10
PPI (Producer Price Index)
First inflation signal from the producer side
Sept 11
CPI (Consumer Price Index)
Main inflation gauge, could confirm a Fed hike
Sept 15
CLARITY Act Senate Vote
Could shape US crypto regulation
Sept 16
Fed Rate Decision
The big one, sets the rate path forward
Sept 18
Bank of Japan Rate Decision
Could shake up USD/JPY and global markets
Core PPI is expected at 0.3%, up from 0.2% last month. Headline PPI is forecast at 0.4%, a jump from 0.0%. Unemployment claims are expected at 205,000, close to last week's 206,000.
CPI is the one traders are watching most closely. July's reading came in at 3.4%. A hot number tomorrow could all but confirm a Fed hike next week.
If the Bank of Japan turns more hawkish on September 18, the USD/JPY pair could swing hard. That kind of move tends to spill over into crypto and other risk assets too.
Why are Bitcoin ETFs seeing outflows today?
Bitcoin ETFs bled $120.24 million on September 9. That is the second-biggest single-day outflow this month.
Fund
Flow
Ark & 21Shares
-$77.98M
Grayscale
-$27.22M
BlackRock (IBIT)
-$19.53M
While Bitcoin funds saw exits, Ethereum told a different story. BlackRock's ETHB fund pulled in $22.94 million, the single highest inflow of the day across any crypto ETF.
XRP ETFs also had a strong day. Bitwise led with $9.30 million in inflows, and the rest of the XRP fund lineup stayed positive too.
So while Bitcoin's price and ETF flows moved together lower, Ethereum and XRP saw buyers step in even as prices dipped.
How is the US Treasury affecting crypto markets right now?
Away from crypto charts, the US Treasury bought back $12.5 billion in short-term debt today. It plans to repurchase up to $6 billion in long-term bonds tomorrow, three times the usual size.
These buybacks are meant to manage bond market liquidity and keep yields in check. It is a macro detail, but it ties into the same risk sentiment that is pushing crypto prices around right now.
Bitcoin price prediction: what are the key levels to watch?
Bitcoin whale holdings have barely moved this week, staying near 5.23 million BTC, according to data shared by Ali Charts. That suggests big holders are not panic selling.
Spot Bitcoin ETFs did see a slowdown, though. Over the last two trading days, outflows totaled $166.89 million, per SoSoValue data. Long-term holders appear to be taking profits, and that selling pressure may be behind the short-term dip.
The good news for bulls is that the $76,000 demand zone has held so far.
On the daily chart, Bitcoin is consolidating after its breakout from the $64,000 zone back in May. Price is now hovering around $78,200.
RSI sits near 59, which means momentum is still positive but cooling off. The 20-day and 50-day EMAs are clustered around $72,700 to $72,900, and Bitcoin remains well above both.
Level Type
Price Zone
Major Resistance
$82,500 - $83,000
Minor Resistance
$81,500 - $82,500
Current Price
~$78,145
Minor Support
$76,000 - $77,000
Major EMA Support
$72,700 - $72,900
Deeper Support
$70,000 - $71,000
Bearish scenario:If Bitcoin fails to close above $82,000 to $83,000, a pullback becomes more likely. A rejection could send it back toward $76,000 to $77,000.
A daily close below that opens the door to $73,000 to $74,000, near the EMA cluster. If that zone breaks too, the next stop is $70,000 to $71,000, then $66,000 to $68,000.
Bullish scenario: If Bitcoin closes strongly above $82,500 to $83,000, especially above the 200-day EMA, the path opens toward $86,000 to $88,000. Beyond that, $90,000 becomes a realistic target.
Ethereum price prediction: Can ETH break its resistance?
Ethereum trades at $2,472.04 today, down 1.80%. The coin has been stuck between $2,400 and $2,550 for over a week now.
Retail selling and a slowdown in demand from bigger buyers seem to be the main reasons for the sideways action.
Near-term resistance sits around $2,520 to $2,530. That level has rejected price several times in recent weeks. Each retest without a sharp rejection tends to weaken resistance over time, which raises the odds of an eventual breakout.
That said, a bearish divergence remains a risk if Ethereum's RSI fails to clear its prior high during any breakout attempt.
XRP price prediction: what levels matter now?
XRP sits at $1.39 today, down over 2.5%, with a market cap of $87.2 billion.
On the daily chart, XRP looks like it's consolidating inside a bullish flag pattern after its earlier rally. Key support sits around $1.35 to $1.36. Resistance is at $1.43 to $1.45, followed by the $1.54 to $1.55 Fibonacci zone.
If XRP clears $1.45 on strong volume, the pattern could target $1.54 to $1.60, with a larger move possibly reaching $1.70.
On the downside, a daily close below $1.35 could weaken the setup and open the door to $1.29 to $1.26. RSI is still above 50, keeping the near-term bias cautiously bullish, but a real breakout is needed for confirmation.
Bottom line
Crypto is cooling off today, not breaking down. Fed rate hike odds, Trump's stimulus comments, and Bitcoin ETF outflows are the main pressure points.
At the same time, whale holdings are steady, key support levels are holding, and Ethereum and XRP ETFs are still seeing inflows. The next ten days, with PPI, CPI, the CLARITY Act vote, the Fed decision, and the BOJ meeting, will likely decide where prices go next.
Disclaimer
This article is for informational purposes only and does not constitute financial, investment, or trading advice. Cryptocurrency markets are highly volatile and carry significant risk, including the potential loss of principal. Prices, percentages, and market data mentioned in this article are subject to change and were accurate at the time of writing. Always do your own research and consult a licensed financial advisor before making any investment decisions.