
DeFi6 min read
TownSquare (TOWN) Nedir?
Merkeziyetsiz finans (DeFi) ekosistemi büyümeye devam ederken, zincirler arasındaki likidite parçalanması ve kurumsal yatırım stratejilerine erişimin sınırlı olması sektörün çözmeye çalıştığı
Bitcoin moved higher at the start of the week’s first Wall Street session, testing fresh local highs as broader markets opened in positive territory. The latest push came alongside reports of
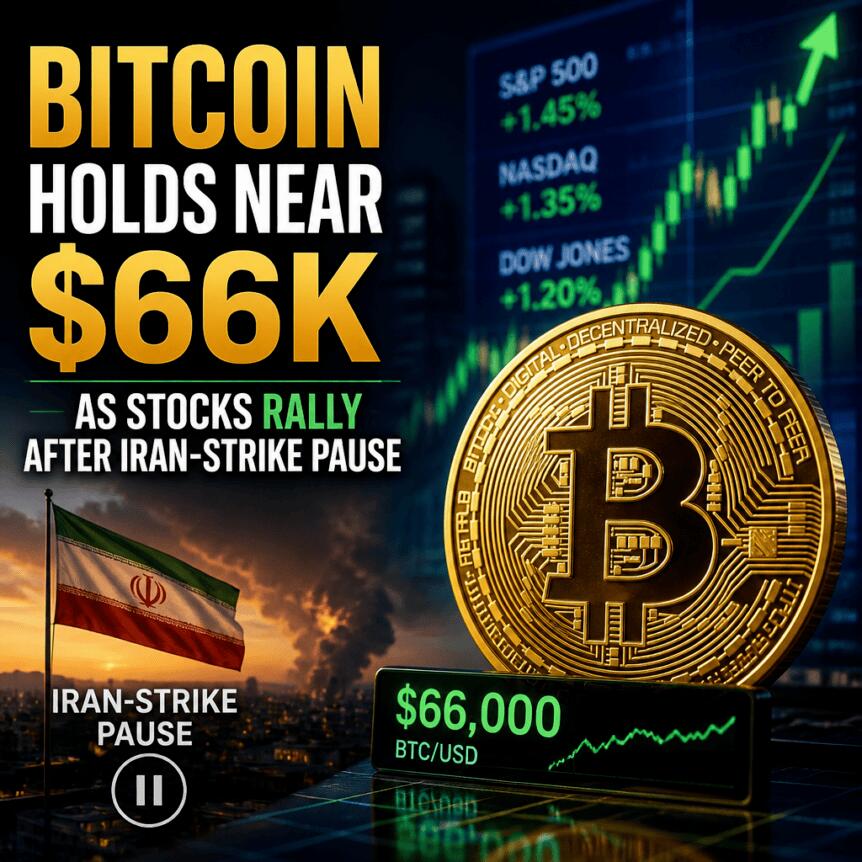
Bitcoin moved higher at the start of the week’s first Wall Street session, testing fresh local highs as broader markets opened in positive territory. The latest push came alongside reports of a pause in US–Iran tensions and renewed efforts connected to the Strait of Hormuz—an outcome that traders viewed as a near-term reduction in geopolitical risk.
According to TradingView data cited in market coverage, BTC/USD spiked toward the $66,000 area as risk assets gained traction. At the time of writing, US equity benchmarks such as the S&P 500 and Nasdaq Composite were up by roughly 0.3%, while WTI crude oil dipped before a modest rebound, reflecting a less volatile energy backdrop than earlier in the month.
The immediate catalyst for Bitcoin’s uptick was macro-linked sentiment tied to the Middle East. TradingView data showed BTC/USD jumping toward $66,000 as traders responded to reports that there had been a pause in strikes between the US and Iran.
Additional reporting referenced statements by an Iranian foreign ministry spokesman indicating that Tehran and Oman were “trying to establish mechanisms regarding maritime traffic” through the Strait of Hormuz, a chokepoint for global oil flows that had been closed. While headlines about reopenings and “mechanisms” can remain fluid, the market impact was clear: energy risk eased at the margin, and that helped equities—and Bitcoin—start the session with momentum.
WTI crude oil, often treated as a proxy for near-term geopolitical stress, fell toward about $82 per barrel before recovering modestly. The combination of a steadier oil tape and higher equity futures aligns with a classic “risk-on” relationship that can temporarily benefit liquidity in major crypto markets.
Even with the immediate tailwind, traders were careful not to overstate the durability of the move. One potential constraint mentioned in the coverage was the risk of higher US bond yields, which can weigh on assets with lower real-yield support.
QCP Capital argued that—despite a more challenging macro backdrop—digital assets had generally outperformed equities during July. In its “Market Color” analysis, the firm said BTC and ETH were up about 11.6% and 24.6% month-to-date, respectively, noting that higher Treasury yields and periodic risk-off episodes had pressured broader markets.
Importantly for investors focused on regulation, QCP also flagged attention around the proposed CLARITY Act. The analysis described ongoing interest from digital asset participants because the bill could affect the US regulatory framework for the sector. The CLARITY Act was referenced as being under consideration, with market participants watching for any progress that could shift expectations around how digital asset rules might evolve.
On the chart, the rally’s quality mattered as much as the direction. Crypto trader and analyst Michaël van de Poppe highlighted that BTC was holding the 21-day and 50-day simple moving averages (SMAs). The levels cited were approximately $64,289 for the 21-day SMA and $63,261 for the 50-day SMA—areas that often function as magnets for both discretionary traders and systematic strategies.
Van de Poppe characterized the holding as a “strong signal” for long-biased positioning, but added that the structure was still “a little fragile.” In a posted view on X, he indicated he would prefer to see a decisive advance into the $66,000–$67,000 band within the next 1–3 days, which would indicate more persistent demand rather than a single-session push.
That distinction is crucial. A market can rise quickly toward resistance levels and still fail if buyers don’t expand after the initial liquidity draw. For traders, the next test is not just whether BTC reaches the higher range, but whether it can keep the bid long enough to convert a “spike” into a sustained move.
Alongside price strength, liquidation data suggested that the move was accompanied by short-covering. CoinGlass data referenced in the coverage showed crypto short liquidations increasing as BTC rallied, with the metric nearing $250 million over a 24-hour period.
Liquidation spikes can be interpreted in two ways: they may signal aggressive leverage being forced out, or they may reflect a crowded short position that becomes vulnerable when the market turns upward. Either way, when large liquidation prints occur near key technical levels, they often coincide with bursts of volatility—meaning traders may see both acceleration and faster reversals if price fails to hold.
With BTC holding important moving averages while testing the upper end of the near-term range, the market now appears to be waiting for confirmation. Traders are watching whether Bitcoin can sustain interest into the $66,000–$67,000 zone, while broader risk sentiment could hinge on continued developments around US–Iran tensions and any tangible progress related to Strait of Hormuz maritime arrangements.
This article was originally published as Bitcoin Holds Near $66K as Stocks Rally After Iran-Strike Pause on Crypto Breaking News – your trusted source for crypto news, Bitcoin news, and blockchain updates.