
Markets3 min read
XRP Pulls Back as BIS Tests XRPL
XRP slipped to around $1.40 after stronger U.S. jobs data revived expectations of another Federal Reserve rate hike, pulling the token lower even as the Bank for International Settlements was
Key Takeaways Bitcoin retreated after reaching $82,250. Binance open interest passed $10 billion. BTC-denominated open interest also increased. Five-year-old outputs are moving more frequentl

Bitcoin was trading near $79,600 at the time of writing, two days after reaching $82,250.
On the daily BTC/USD chart, price remained above the 50-, 100- and 200-day simple moving averages. Those trend references were positioned between approximately $66,400 and $69,700, confirming how far Bitcoin has recovered since August.
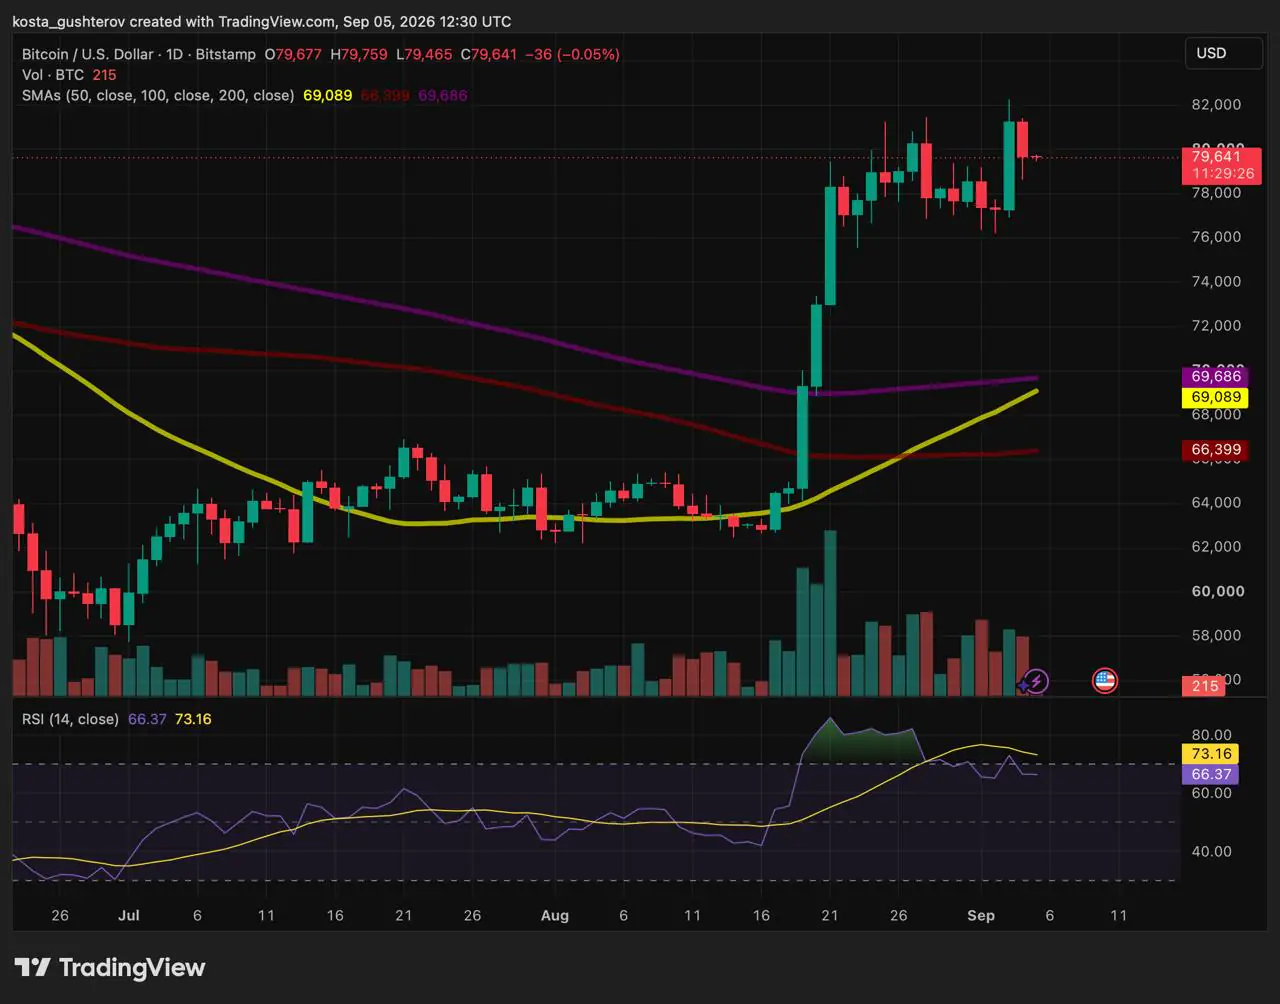 Bitcoin daily price chart on Bitstamp with moving averages and RSI indicator.
 Their distance below the market also means they offer little guidance about immediate support near $79,600. The shorter-term question is whether Bitcoin can remain inside its recent range before challenging the September high again.
An earlier analysis of Bitcoin’s recovery levels identified $81,480 as the first major ceiling. Bitcoin subsequently traded above that level, but its retreat below $80,000 shows that buyers did not establish lasting acceptance above the wider $82,000 area.
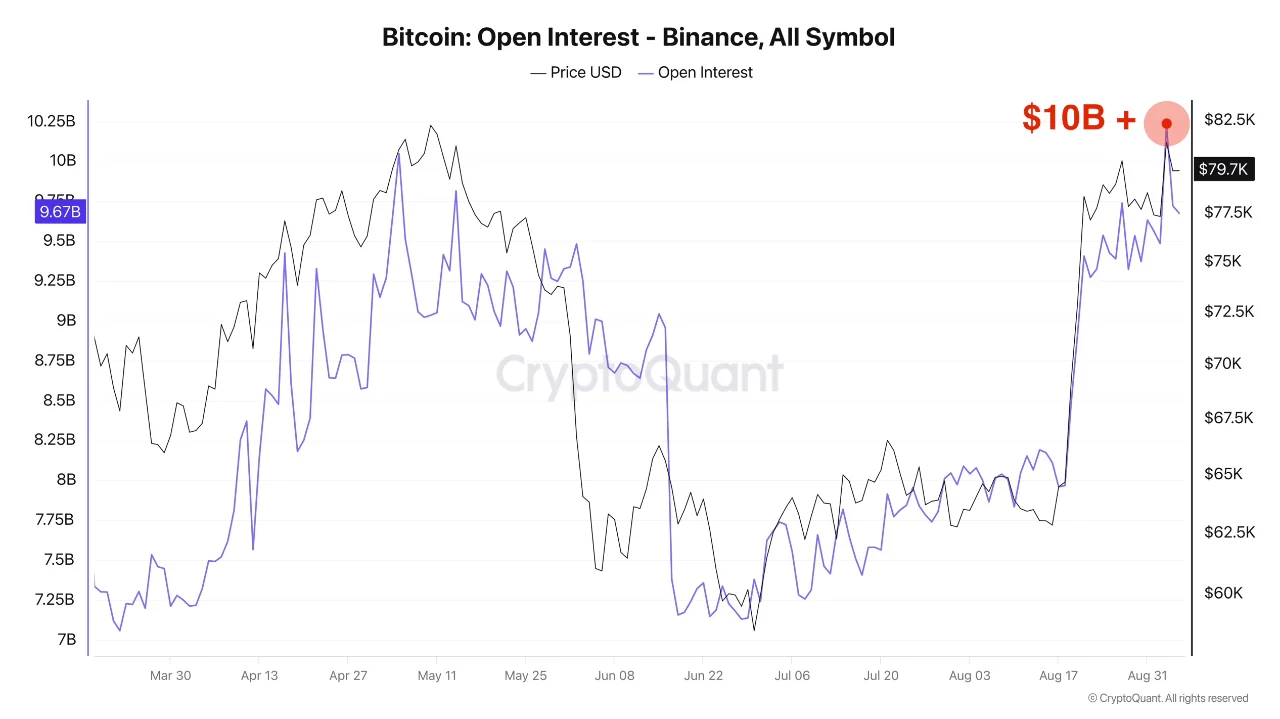
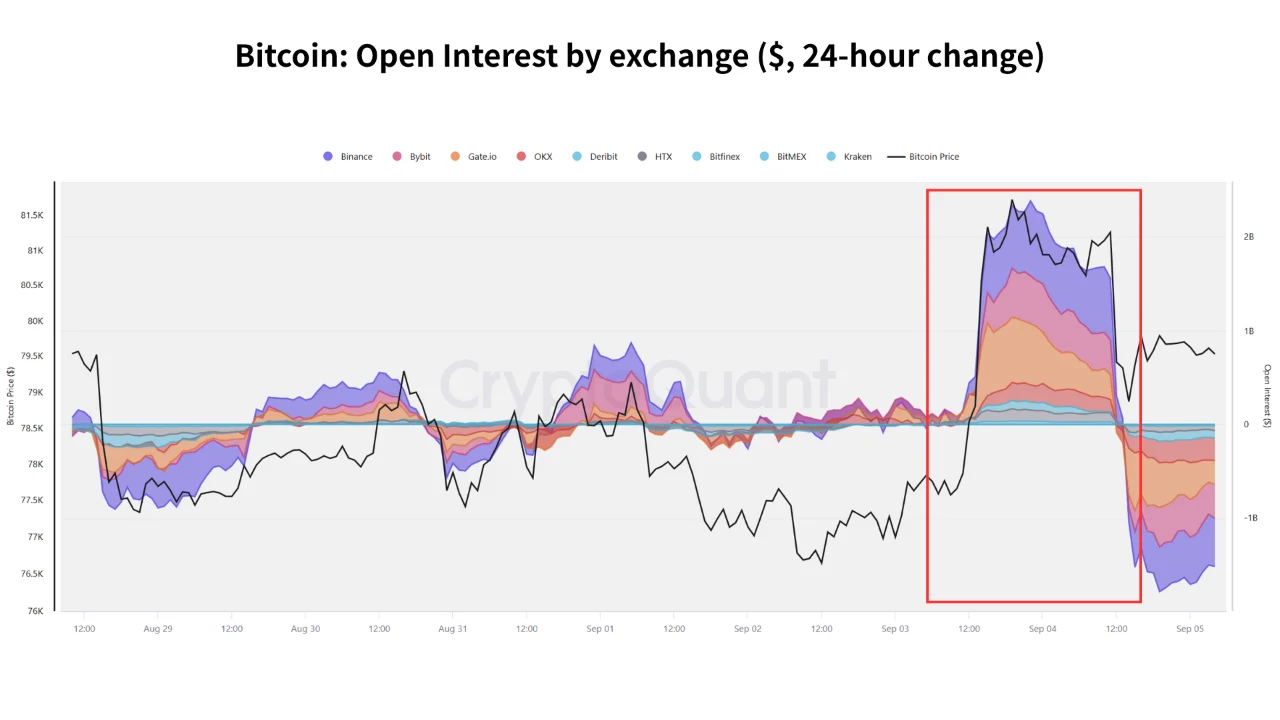
A CryptoQuant analysis by Darkfost reported that Binance Bitcoin open interest increased nearly 8% in 24 hours and exceeded $10 billion, its highest dollar value in six months.
What changed on Binance
$10B+
Dollar-denominated Bitcoin open interest.
125,830 BTC
Outstanding exposure expressed in BTC.
37%+
Binance’s reported share of Bitcoin open interest.
Part of the dollar increase came from Bitcoin becoming more valuable, which raised the notional value of contracts that were already open. However, CryptoQuant’s BTC-denominated measure also climbed, indicating that outstanding exposure expanded after much of that price effect was removed.
The 125,830 BTC reading is a unit of measurement, not proof that the same amount of physical Bitcoin was deposited or locked as collateral. It expresses the notional size of the contracts in BTC terms.
Open interest also cannot reveal whether aggressive buyers, hedging activity or new short exposure drove the increase. Every futures contract has both a long and a short side. Funding rates, futures basis and order-flow data are required to judge which side is paying more aggressively for exposure.
The increase means more notional futures exposure remains open and vulnerable to a sudden price movement. That can amplify volatility if traders begin closing positions together.
A separate CryptoQuant analysis found that the 90-day moving average of spent outputs from Bitcoin held for more than five years had reached approximately 1,500 BTC. The reading was around twice its level in May.
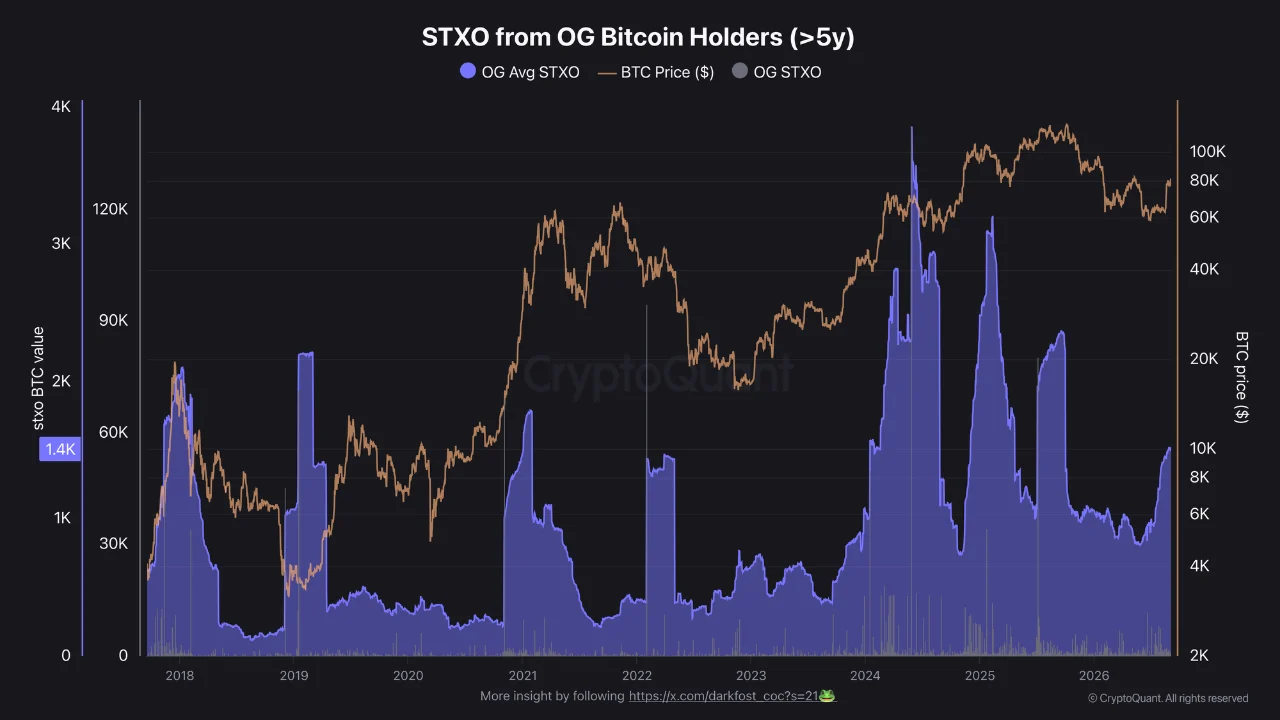 STXO from OG Bitcoin Holders (>5y) chart from CryptoQuant.
 Bitcoin records balances as unspent transaction outputs, commonly called UTXOs. Once an output is included in a new transaction, it becomes a spent output. Its age indicates how long the coins had remained untouched, but not why they moved or where they ultimately went.
Some of these transfers may precede sales, but wallet consolidation, custody changes and security upgrades can produce the same on-chain signal. Darkfost cited wallet reorganization after the Coldcard episode as one possible explanation, although the metric cannot identify individual motives.
An earlier report on the Coldcard wallet flaw explains how defensive wallet migrations can wake dormant coins without creating immediate sell-side supply.
The 1,500 BTC figure therefore measures greater activity among older outputs. It is not the amount sold by long-term holders during a single session.
Some of the renewed activity also reached exchanges. A third CryptoQuant analysis reported that large Bitcoin deposits increased as BTC advanced from the mid-$60,000s into the upper-$70,000s, with Binance receiving many of the largest inflows.
 Bitcoin Open Interest on Binance chart highlighting the 10 billion dollar milestone.
 The activity was not confined to Bitcoin: seven-day altcoin deposit transactions reportedly climbed from approximately 15,000-20,000 around the August lows to roughly 45,000.
Moving BTC onto an exchange makes it easier to trade, but a deposit is not a completed sale. The coins may instead be used for market making, arbitrage, custody or collateral.
Rising Binance inflows and higher futures open interest could partly reflect related activity. Some deposited BTC may support coin-margined positions or other trading strategies, although the available data do not connect specific deposits to individual futures contracts.
Much of Binance’s derivatives activity can also use stablecoin collateral, so the two datasets should not be treated as direct equivalents.
What is visible
Futures exposure increased in both dollar and BTC terms.
Older outputs began moving more frequently.
Large exchange deposits also increased.
What the metrics cannot show
Whether older coins were transferred for sale.
Whether exchange deposits funded futures positions.
Which side initiated the new derivatives exposure.
Another advance through the September resistance would be more convincing if spot-market activity strengthened with it. Spot buying provides direct demand for the underlying asset without requiring a futures contract that can later be liquidated.
The available open-interest data confirm that futures participation increased, but they do not measure how much unleveraged demand is waiting above $80,000. Spot volume and order flow will provide a more direct test when Bitcoin revisits the resistance zone.
Open interest confirms that positions are being added; it does not establish that the underlying trend is healthy. If exposure keeps expanding while BTC repeatedly fails to advance, more positions become vulnerable to a sudden move outside the range.
Funding and futures basis can add context. Rapidly rising positive funding would show that leveraged long positions are becoming more expensive to maintain, increasing the risk of an unwind if price falls.
Gross inflows measure BTC entering identified exchange wallets without subtracting withdrawals. Netflow provides a clearer view of whether exchange-controlled balances increased over the same period.
Even positive netflow cannot prove that retained coins will be sold. It can, however, show whether more BTC remains readily available inside exchange infrastructure while the market tests resistance.
READ MORE: Strategy Becomes Top Holding in Tom Lee’s $4.5B ETF
Bitcoin attracted new futures exposure just as older coins and whale deposits became more active. Whether that activity supports or disrupts the recovery now depends on the strength of spot demand.
A move above the resistance zone would be more credible if spot activity expanded without an equally sharp build-up in leveraged exposure. Until that happens, the increase in participation shows that Bitcoin is attracting attention again, not that buyers have secured its next leg higher.
The article is provided for informational purposes only and does not constitute investment advice.
The post Bitcoin’s Failed $82K Breakout Reveals a Bigger Test appeared first on Coindoo.