Something just changed for Bonk. Two big moves landed in 48 hours, the kind that don't show up together very often. A major hardware wallet brand picked Bonk for a limited collab. A top tradi
Something just changed for Bonk. Two big moves landed in 48 hours, the kind that don't show up together very often. A major hardware wallet brand picked Bonk for a limited collab.
A top trading platform made Bonk free to trade. And the altcoin market is just starting to heat up. If you've been watching the Bonk price prediction space, right now is the moment to pay attention.
Is $BONK Finally Waking Up in 2026?
The Bonk price prediction is getting serious attention this week. Two big things happened back to back, and the crypto crowd noticed fast.
Money is quietly moving away from the big coins and into smaller ones right now. $BONK is one of the names catching that wave. And with a Ledger collab and free trading on dYdX both dropping in the same week, the timing couldn't be better.
A Quick Look at Bonk's Numbers Today
Detail
Info
Coin Name
Bonk
Ticker Symbol
BONK
Blockchain
Solana
Today High
$0.00000469
Today Low
$0.00000432
RSI Level
61.77
Token Type
Meme / Community Token
Market Cap
$407.14M
24H Trading Volume
$37.95M
Circulating Supply
87.99T BONK
24H Change
+3.93%
Source: Data by CoinMarketCap
Why $BONK Is in the News Right Now
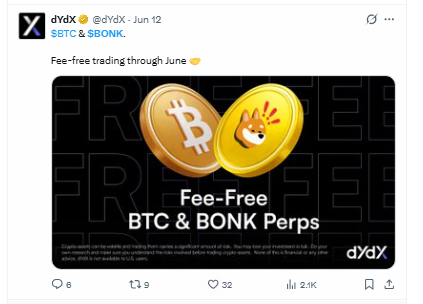
Two things happened back to back this week. On June 12, dYdX announced fee-free trading for BTC and $BONK perps (a type of trading contract) through the end of June. That's real money saved for traders, and it pulled in volume fast.
Then on June 14, the official Bonk account posted that the limited edition $BONK x Ledger Nano S Plus was almost sold out.
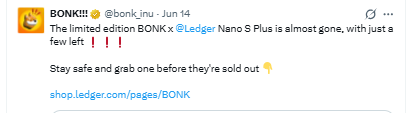
Ledger is one of the most trusted names in crypto wallets. A collab like that shows Bonk is being treated as a real coin, not just a joke.
Basically, two pieces of real news landed in 48 hours. That doesn't happen by accident.
Where Is $BONK Being Traded the Most?
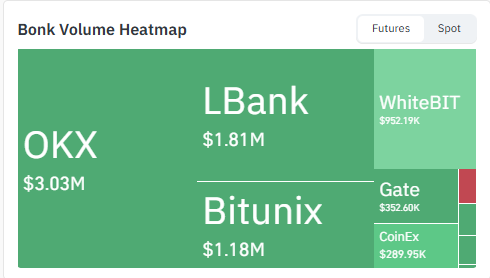
The volume heatmap shows exactly where the real trading action is happening right now.
OKX is sitting at the top with $3.03M in Bonk spot volume. LBank isn't far behind at $1.81M, and Bitunix is holding its own at $1.18M.
Source: Data by CoinGlass
WhiteBIT, Gate, and CoinEx are all in the mix too, just at smaller sizes. And that spread across so many exchanges is actually a good thing. A move backed by one exchange is easy to fake. This one isn't.
OKX leading the pack matters too. It's one of the biggest crypto exchanges in the world. Big volume there means real traders are paying attention, not just small accounts chasing a meme.
What the $BONK Chart Says Right Now
This is the 4-hour chart, and it's telling a clear story right now.
$BONK just burst through the top of an ascending triangle (a chart shape where the price keeps making higher lows and pushes against a flat ceiling). That ceiling sat near $0.00000456.
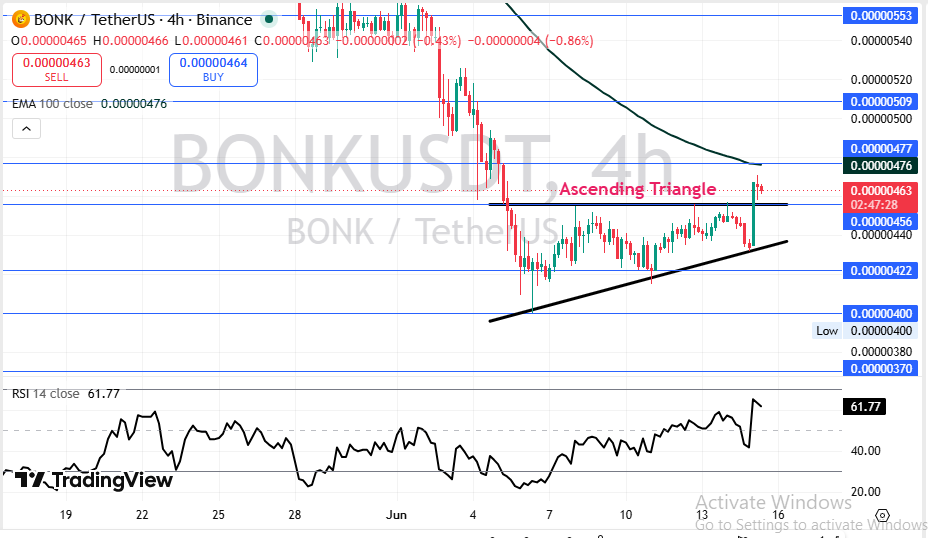
Source: Charting by TradingView
The price is now trading above that old wall at $0.00000463. Here's what most traders are missing: the RSI is sitting at 61.77. That's not at extreme levels yet. There's still room to move higher before it gets too hot.
But the 100 EMA is still hanging above at $0.00000476. That's the next real wall. Until the price closes above that on a 4-hour candle, this rally could stall.
Where Could $BONK Go in the Short Term?
The chart looks more like a setup for continuation than a reversal right now. But the EMA is the gatekeeper.
Timeframe
If Price Falls
Most Likely
If Price Rises
What Could Cause This
24 Hours
$0.00000432
$0.00000463
$0.00000477
EMA gets crossed on strong volume
3–7 Days
$0.00000422
$0.00000476
$0.00000509
Altcoin flow stays strong, traders hold
2–4 Weeks
$0.00000400
$0.00000490
$0.00000553
Big market move or more news from the team
Watch that $0.00000476 level hard. If it flips to a floor instead of a ceiling, things could move fast.
Where Could $BONK Go Over the Long Term?
The big picture depends on where the wider crypto market goes in the second half of 2026. Bonk needs altcoin season to last, or it will fade with the rest.
Timeframe
If Price Falls
Most Likely
If Price Rises
What Needs to Happen
3 Months
$0.00000300
$0.00000520
$0.00000700
Altcoin flow keeps going, no big market crash
6 Months
$0.00000200
$0.00000600
$0.00000900
New partnerships and token burn events
End of Year
$0.00000150
$0.00000550
$0.00000850
Crypto market stays warm through Q4 2026
2027 Outlook
$0.00000100
$0.00000700
$0.00002000
Full altcoin bull cycle with community growth
The long-term case is real but not guaranteed. Meme coins move in waves, and $BONK is no different.
Three Ways This Could Play Out
Worst Case:The EMA holds as a strong ceiling, and sellers step in hard. The market turns risk-off, and $BONK loses the triangle gains entirely.
Most Likely Case:$BONK grinds sideways just below the EMA for a few days. Then it pushes through with help from a broader altcoin move and hits $0.00000509.
Best Case:The EMA breaks fast, volume surges, and the dYdX news brings in new buyers. Bonk races toward $0.00000553.
Scenario
Price Range
What Makes It Happen
Worst Case
$0.00000300 –$0.00000400
Sellers take over, and the market goes risk-off
Most Likely
$0.00000463 – $0.00000509
EMA breaks slowly; altcoin flow continues
Best Case
$0.00000509 – $0.00000553
News + volume combo sparks a sharp rally
Key Price Walls to Watch Right Now
Price wall above: $0.00000476 is the 100 EMA. Getting above this and staying there is the single biggest unlock. After that, $0.00000509 is the next challenge.
Price floor below:$0.00000456 is the first spot. Below that, $0.00000422 is the next stop. Then $0.00000400 comes in as a round-number floor that big traders tend to defend.
Break point:A drop below $0.00000377 would cancel the triangle pattern entirely. That would be a bad sign for the short-term Bonk price prediction.
Analyst View and What It All Means
When we looked at the chart, the first thing that stood out was how clean the ascending triangle breakout was. Price didn't just poke through. It moved with purpose.
The RSI at 61.77 is healthy. It's not screaming too hot. There's room to run before sellers get nervous. But this is the part that matters; the 100 EMA above the price is the only thing holding this back right now.
We've seen this setup before. Either the EMA breaks fast and the move is real or the price gets rejected and fades back into the range. Turns out, the next two or three daily candles will tell us everything.
Outside the chart, the dYdX fee-free trading is a quiet but real plus. More traders using $BONK perps means more eyes on the price. And the Ledger collab is not small news. It says the Bonk brand has weight now.
Here's the thing: the most important level to watch right now is $0.00000476. That's the EMA. That's the gatekeeper. If $BONK closes above it on a 4-hour candle with strong volume, the next target is $0.00000509. If it doesn't, expect sideways movement for a few more days.
One last thought: meme coins don't need perfect charts. They need community. And right now, Bonk has both.
Disclaimer
This article is for learning only and does not tell you what to do with your money. Crypto prices can go up or down very fast. Talk to a money advisor before you invest.