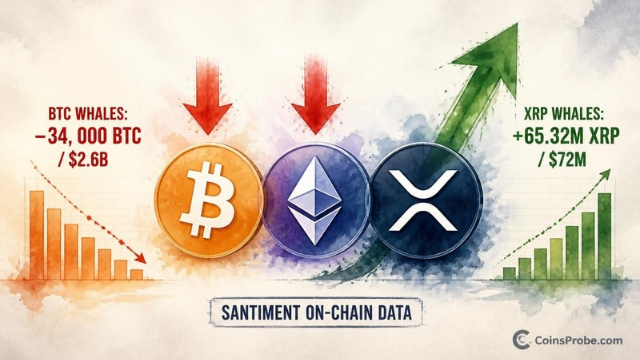
Key Highlights XRP at $1.063 (−2.83% 24h): whales accumulated 65.32M XRP (~$72M) in just 4 days while BTC and ETH whales sold Bitcoin whales shed 34,000 BTC (~$2.6B) as BTC fell from $79,000
Key Highlights
XRP at $1.063 (−2.83% 24h): whales accumulated 65.32M XRP (~$72M) in just 4 days while BTC and ETH whales sold
Bitcoin whales shed 34,000 BTC (~$2.6B) as BTC fell from $79,000 to below $73,000 over the past week per Santiment
XRP spot ETFs recorded $18.0M in net outflows over 5 consecutive outflow days (data via SoSoValue) — contrasting whale on-chain accumulation
ETH whales reduced holdings by ~17,800 ETH (~$40M) in the same week, but at 65x smaller dollar scale than BTC distribution
XRP is trading at $1.063 — down 2.83% in the past 24 hours — while Santiment on-chain data reveals a striking divergence: the same week that Bitcoin and Ethereum whales were offloading billions in holdings, XRP’s largest wallets were quietly accumulating. The contrast is not subtle. It is directional, and it is quantified.
An on-chain analyst published a five-part thread dissecting whale behavior across BTC, ETH, and XRP simultaneously, using Santiment wallet-flow data. The finding: while macro pressure pushed crypto markets lower, large XRP holders moved in the opposite direction from their Bitcoin and Ethereum counterparts — buying into the dip rather than selling into it.
As BTC fell from $79,000 to below $73,000 over the past week, large Bitcoin holders reduced their on-chain holdings by more than 34,000 BTC — equivalent to approximately $2.6 billion at prevailing prices. The Santiment bar chart covering days 4 through 10 of the observed window shows a clear descending staircase pattern, with whale holdings declining from approximately 5.28M BTC toward 5.24M BTC at the most recent data point.
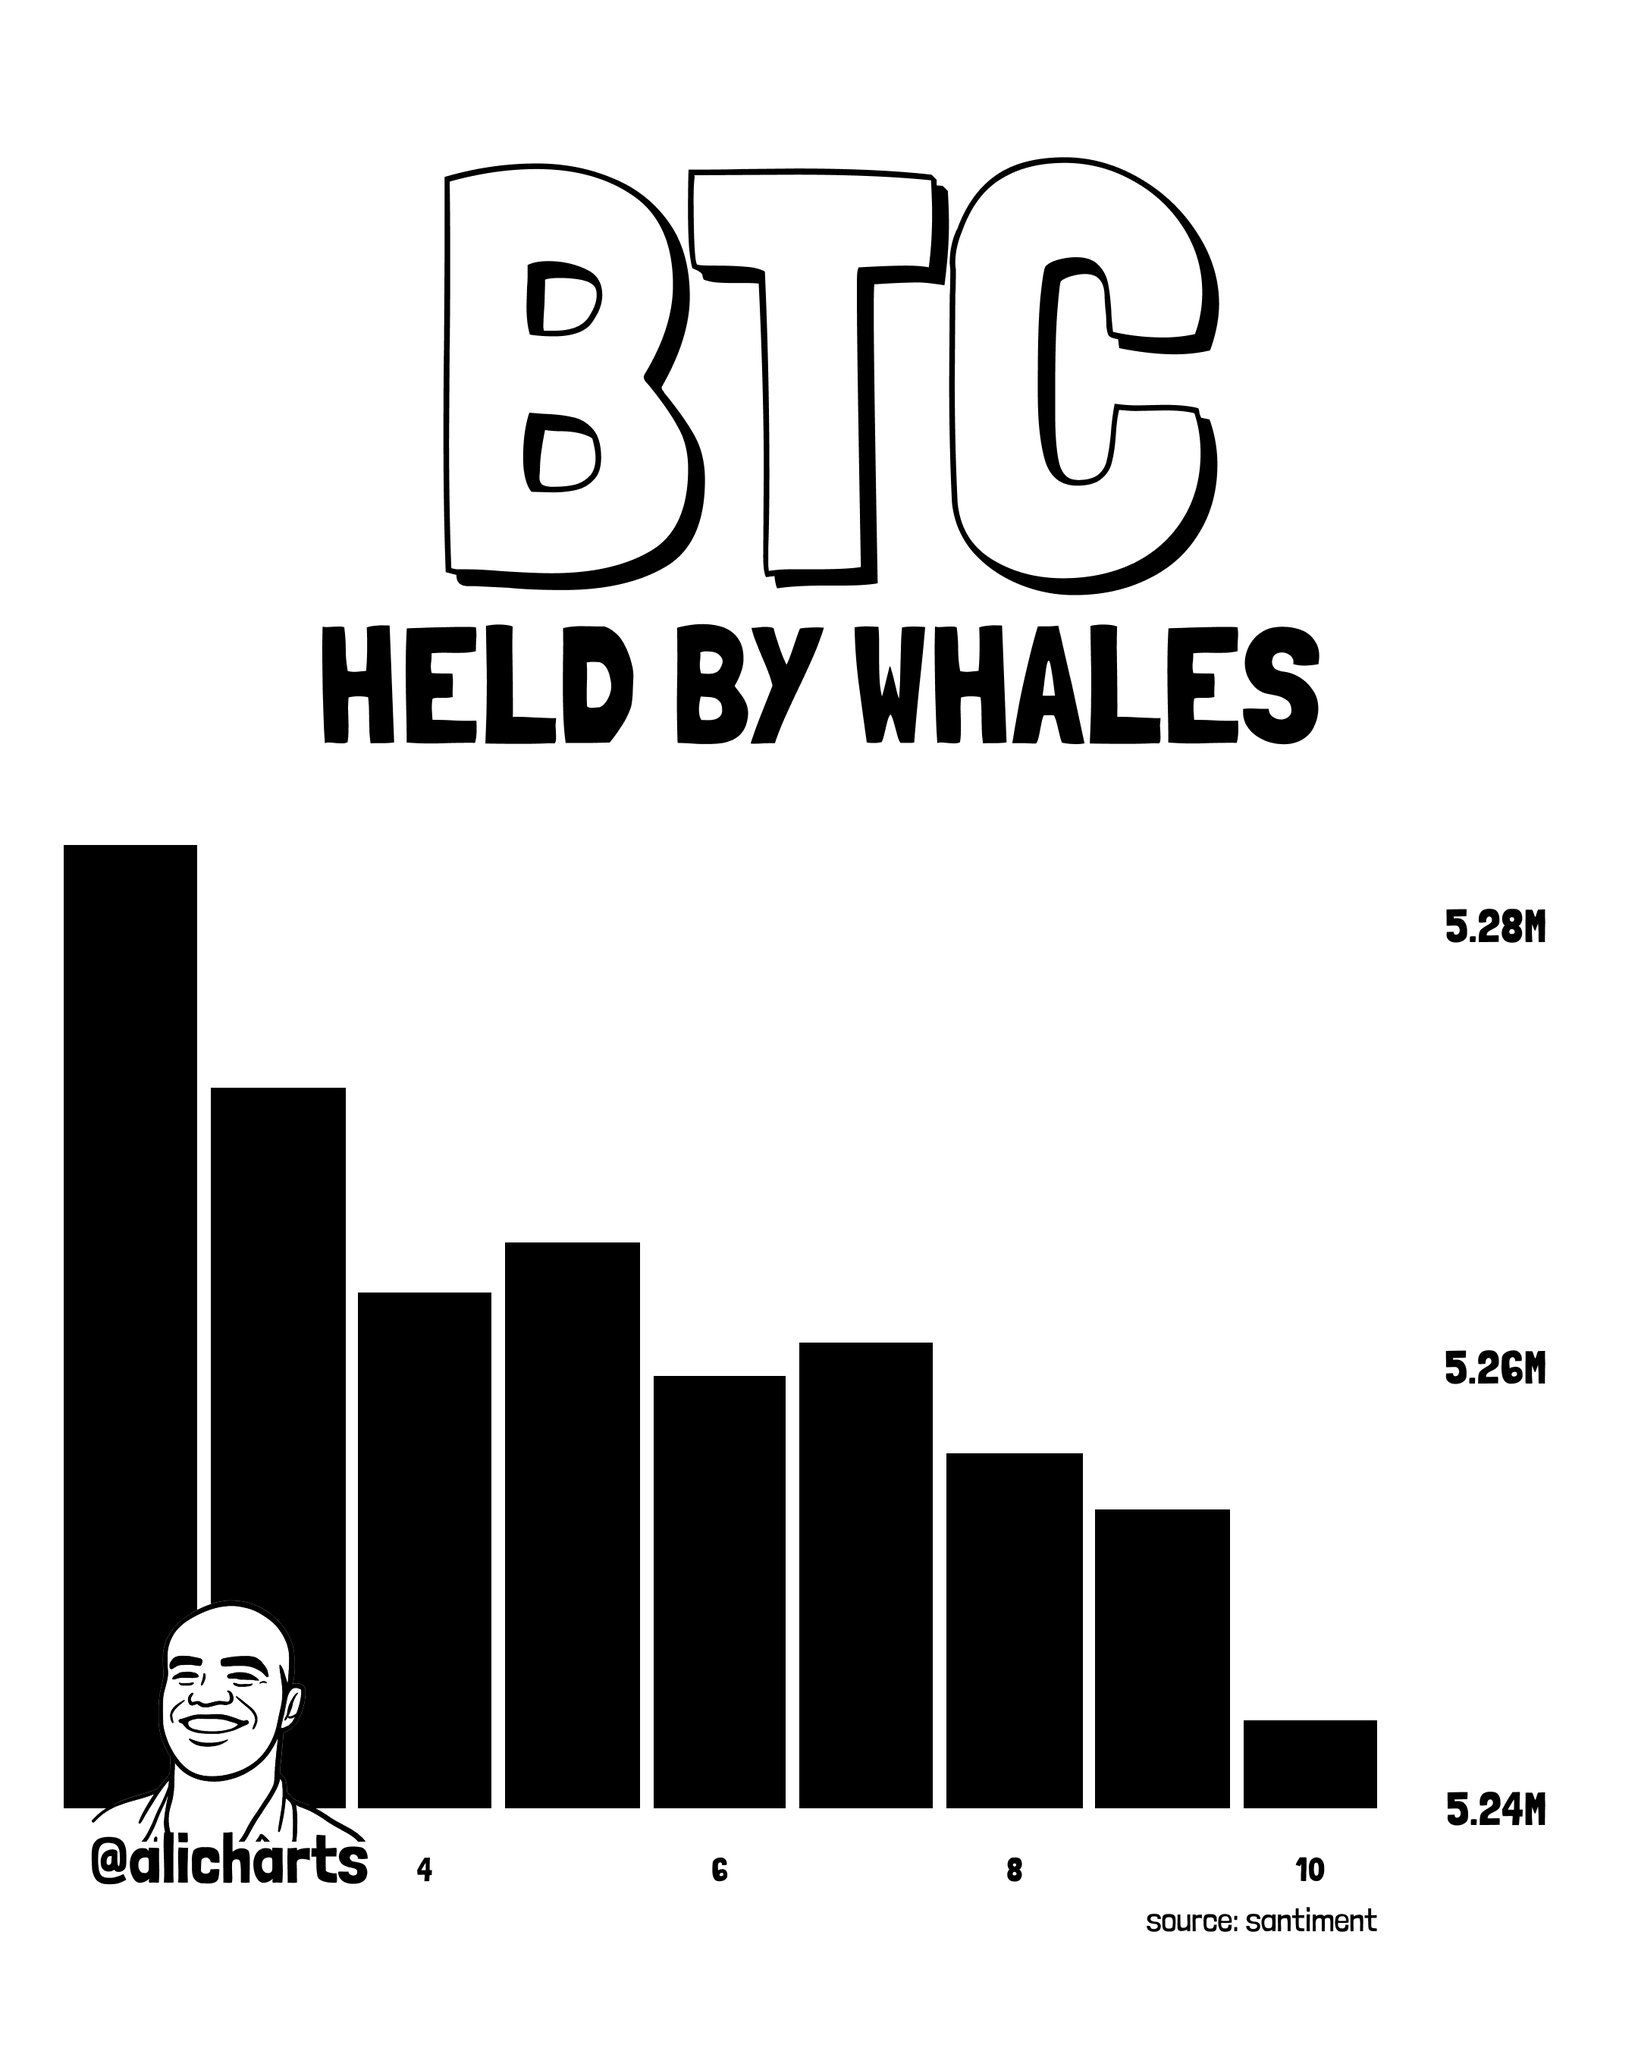
Chart Analysis: BTC Held by Whales | Source: @alicharts (X)
This is distribution, not repositioning. Whales were reducing exposure as price fell — selling into weakness rather than absorbing it. The 34,000 BTC reduction is not a rounding error; it represents one of the larger short-term large-holder outflows visible in Santiment’s wallet-tracking data this cycle. For context on what large-scale on-chain movements can signal, USDT supply also contracted $6.6B in 60 days — another on-chain signal consistent with broader de-risking.
Ethereum’s large holders followed a similar directional trend, though with notably less conviction. Over the same week-long window, whale wallets reduced ETH holdings by approximately 17,800 ETH — worth roughly $40 million at recent prices. The Santiment bar chart for ETH whale holdings (y-axis: 25.5M to 25.9M ETH) shows a pattern that peaked early in the observed period, dipped through the middle, briefly recovered around day 9, then resumed lower — a less uniform decline than BTC but directionally consistent.
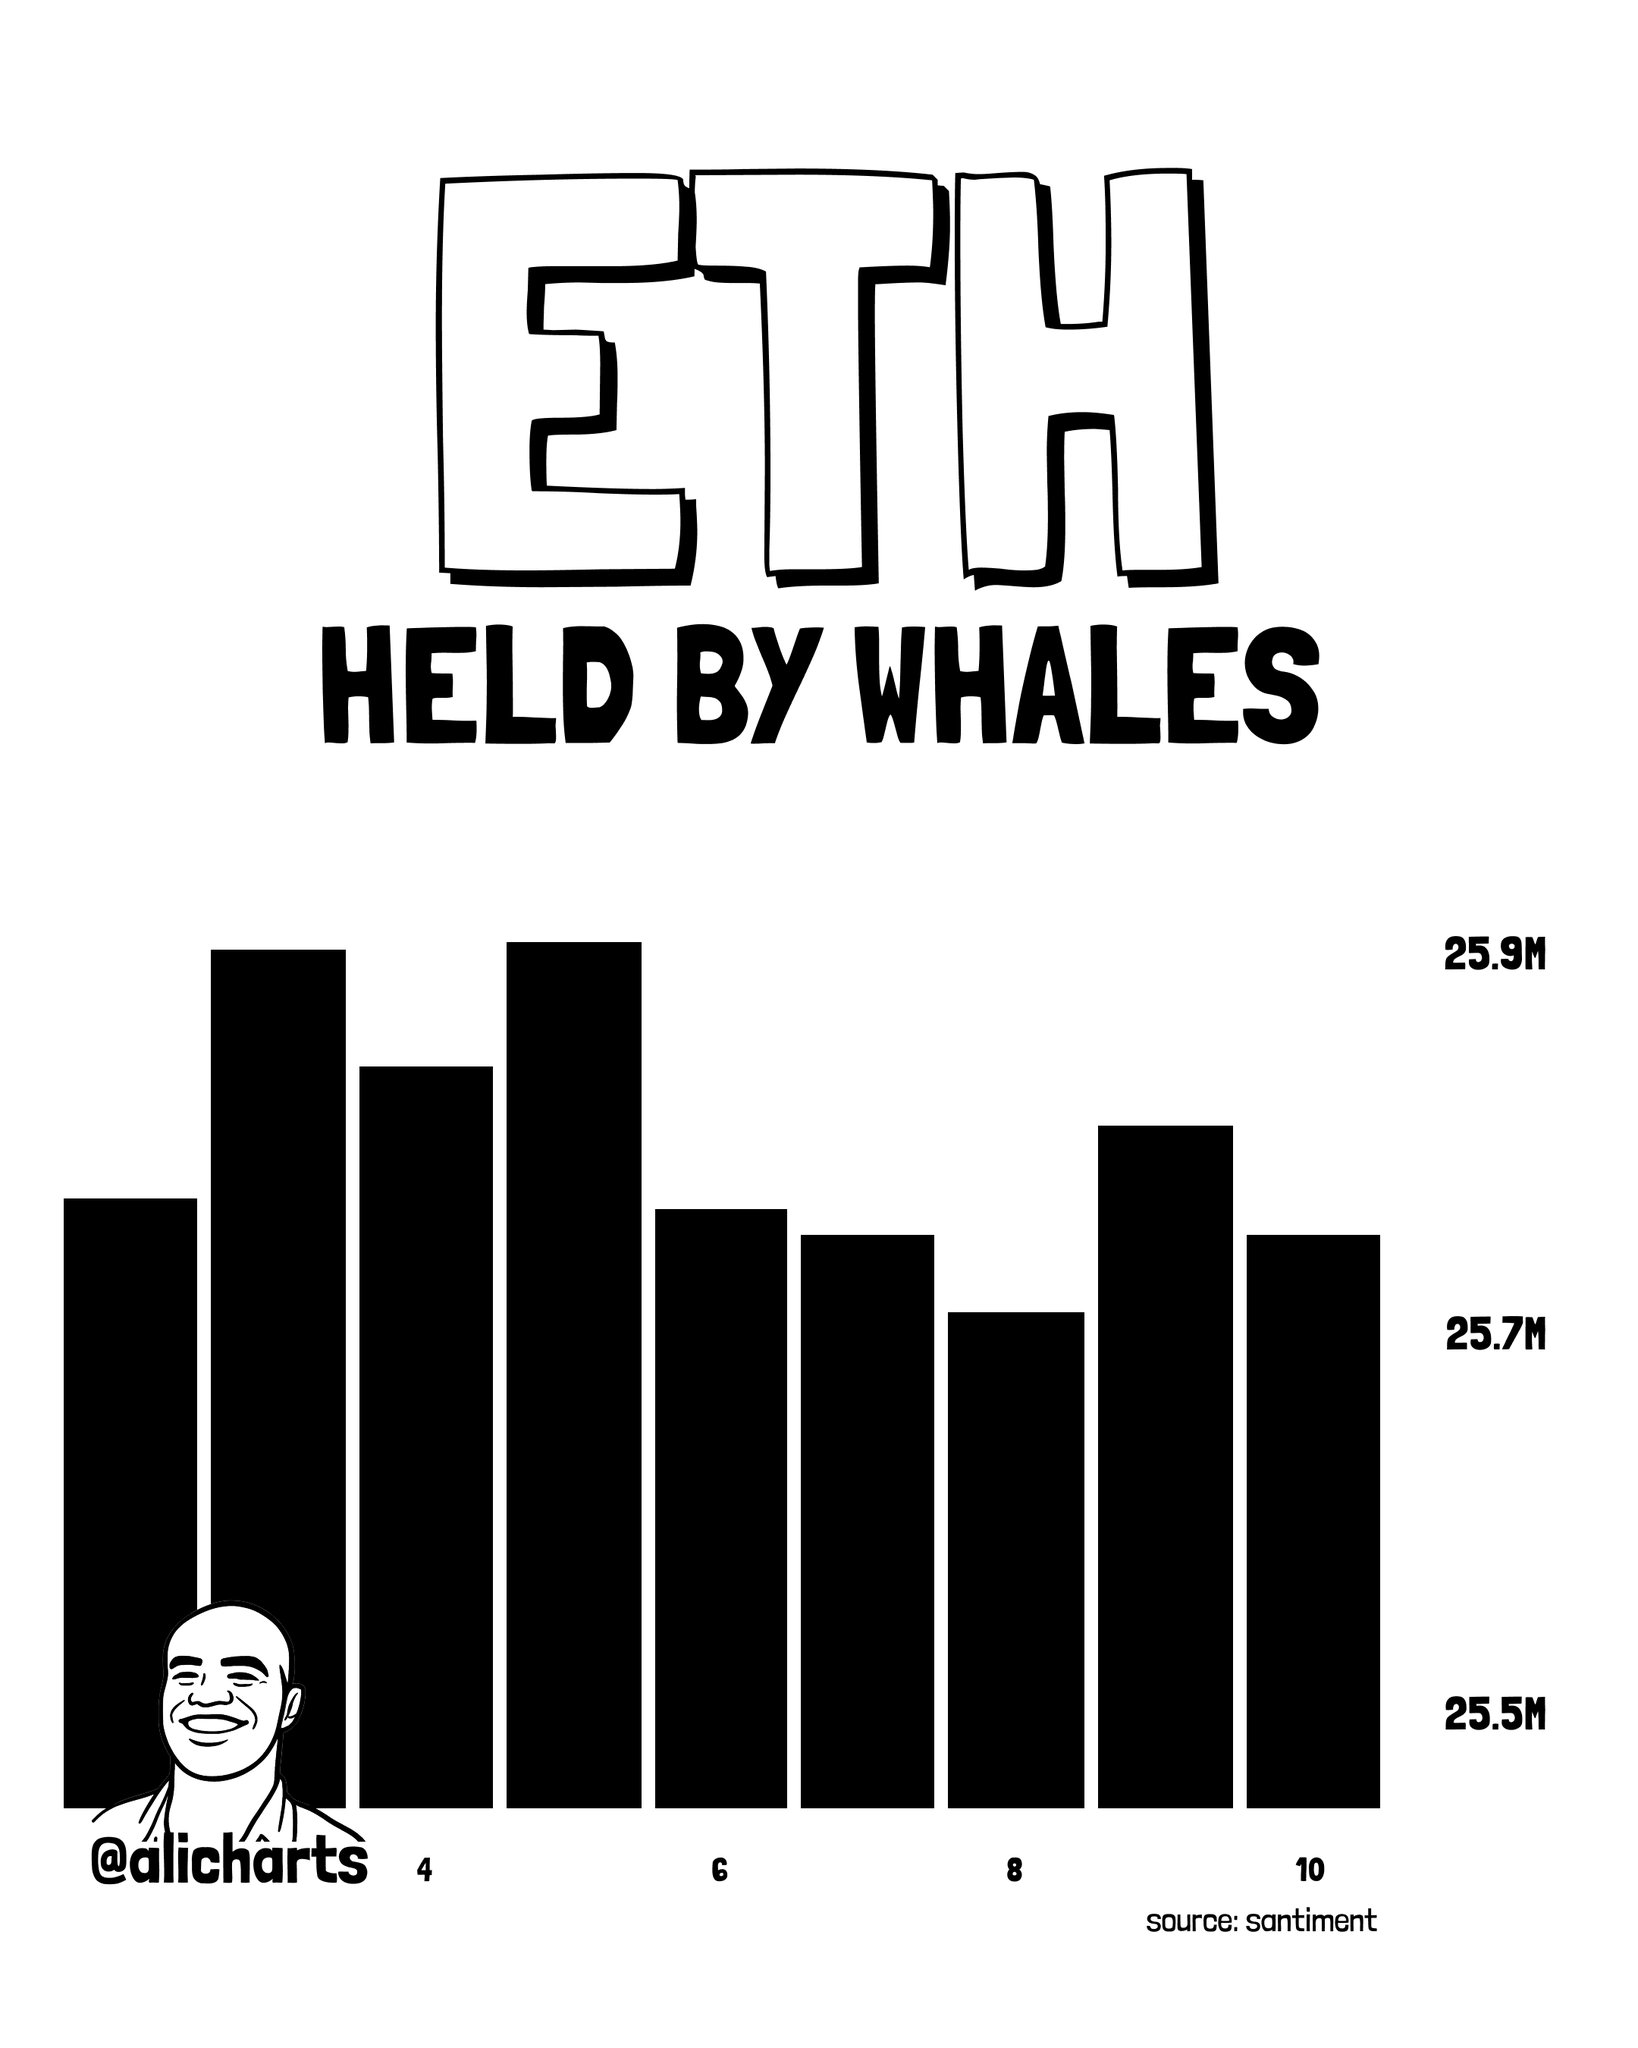
ETH Held by Whales | Source: @alicharts (X)
The magnitude difference is significant. BTC whales moved $2.6 billion in one week. ETH whales moved $40 million over the same period — roughly 65 times smaller in dollar terms. Whether that reflects relative conviction, liquidity constraints, or portfolio composition differences is not stated in the data. What is stated: both are net sellers. Ethereum has its own technical dynamic playing out at the 0.618 Fibonacci level — worth watching alongside this whale data.
This is where the divergence becomes material. While Bitcoin and Ethereum whales distributed holdings across a full week of declining prices, XRP’s largest holders accumulated 65.32 million XRP — approximately $72 million — over just the past four days. The Santiment bar chart for XRP whale holdings (y-axis: 3.90B to 4.00B XRP) shows a U-shaped recovery: holdings dipped through days 5–7, then reversed sharply, with the rightmost bar (day 10) reaching the highest point on the chart near the 4.00B level.
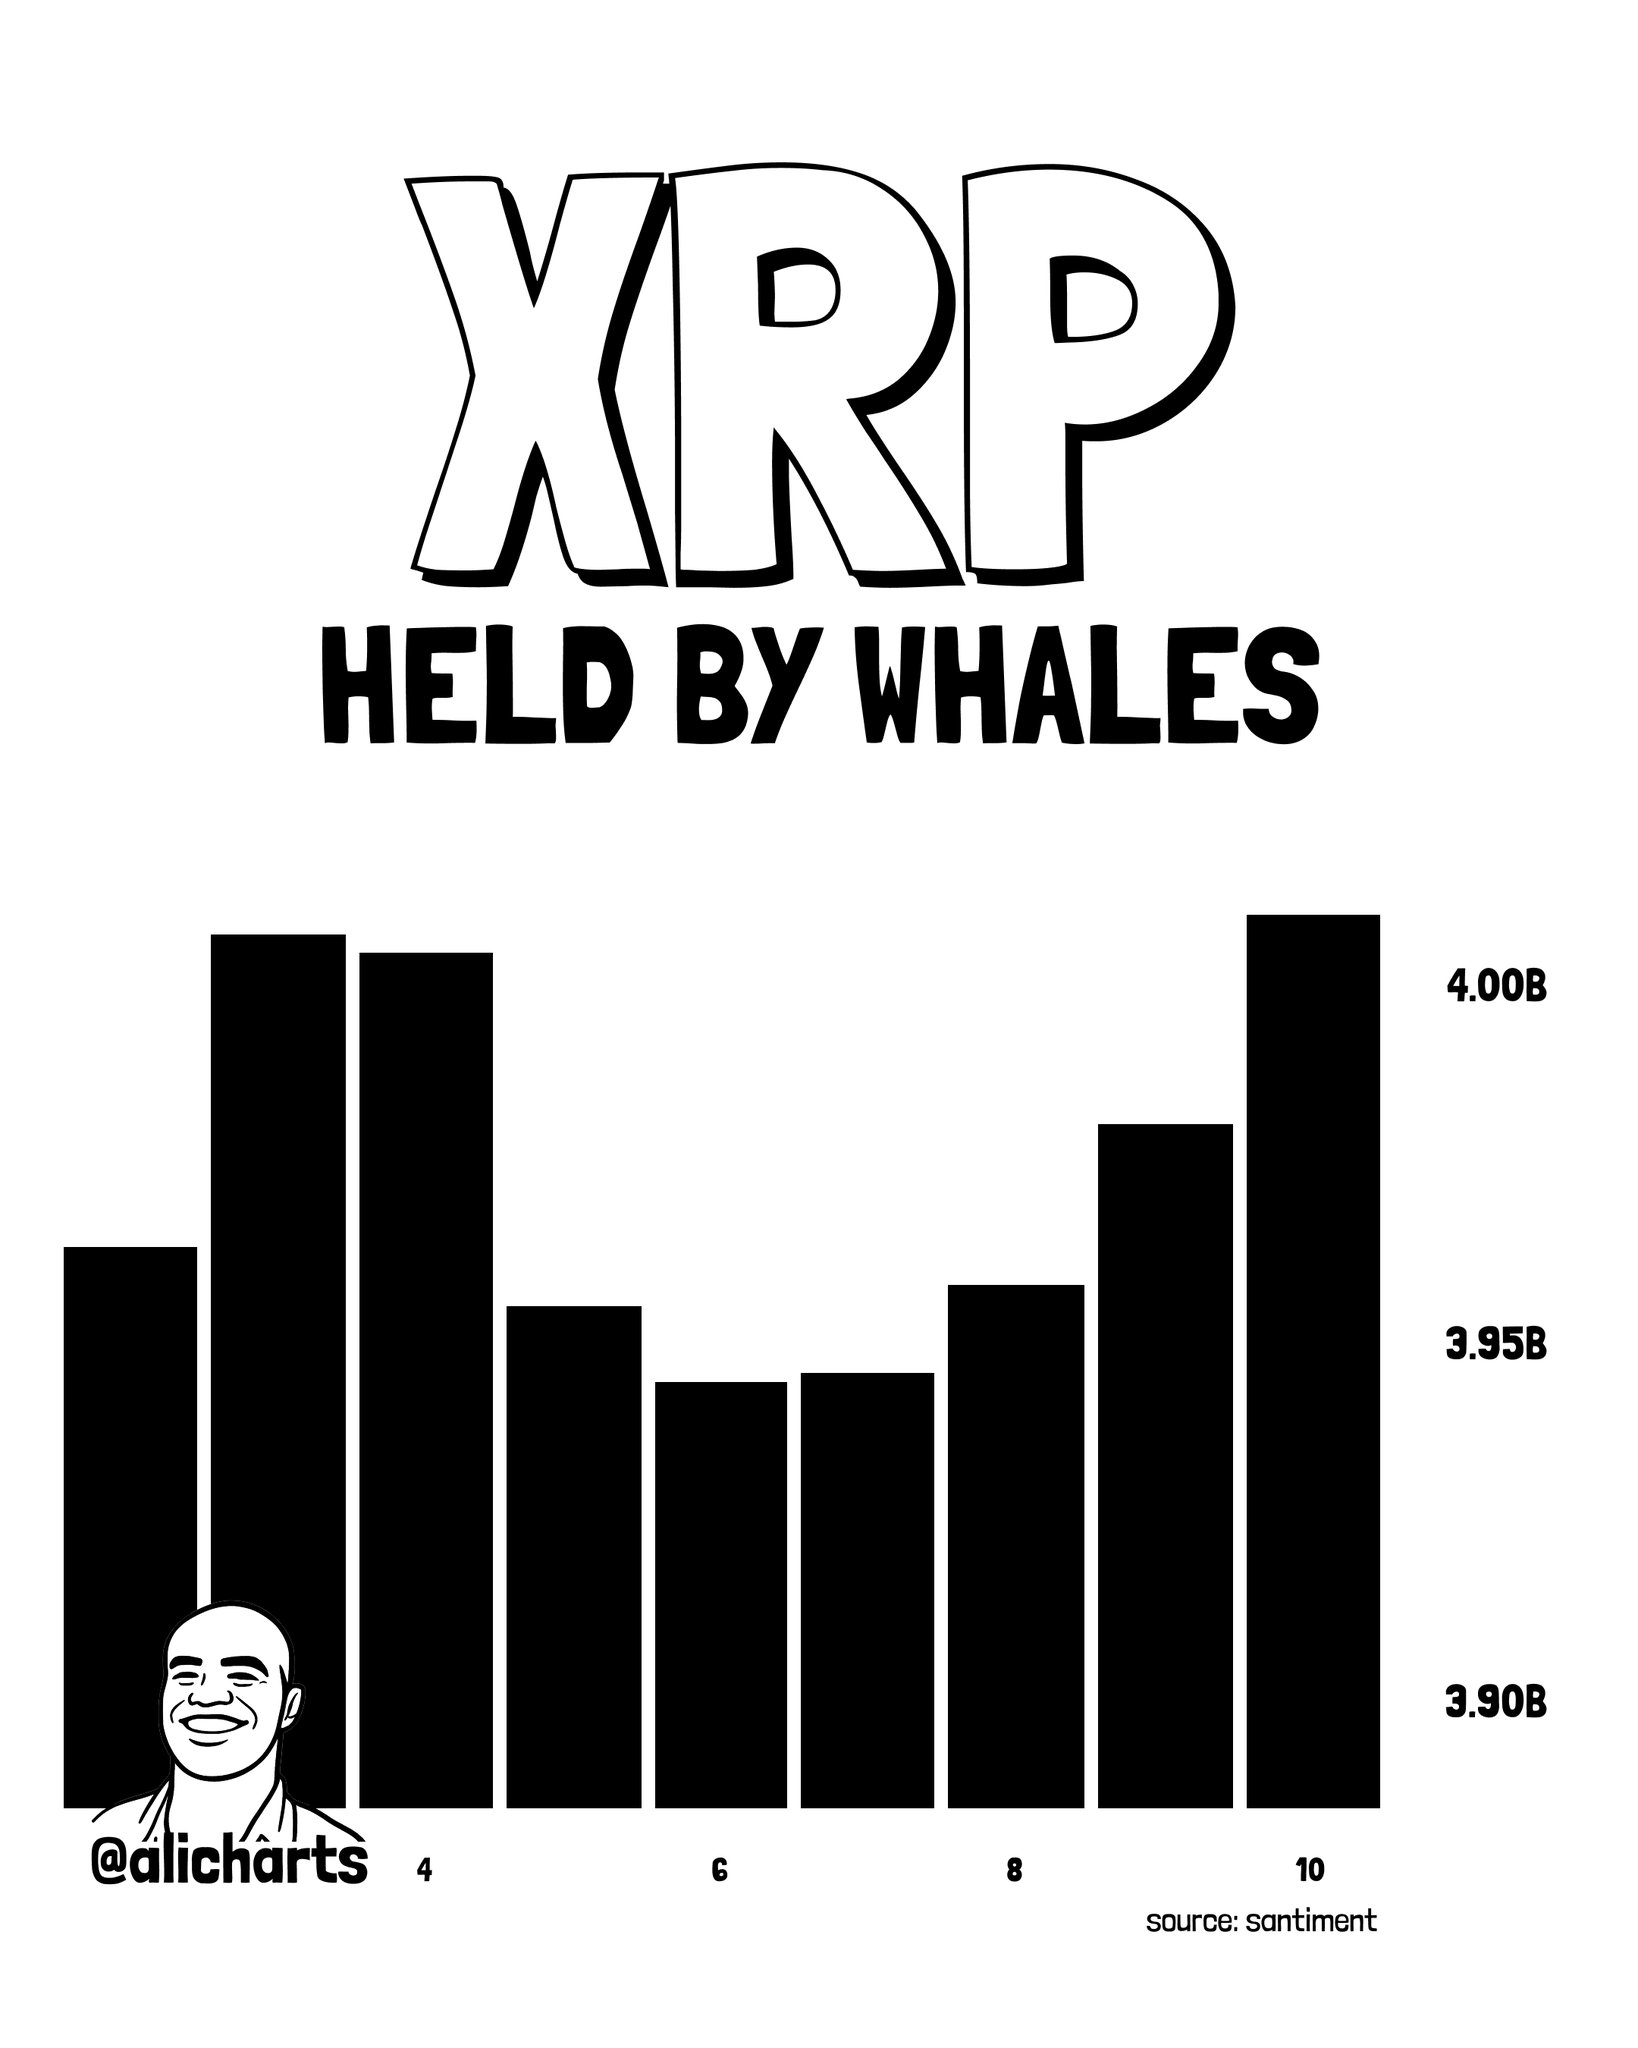
XRP Held by Whales | Source: @alicharts (X)
Sixty-five million XRP is not a rounding error. At $1.10 per token (approximate price during the accumulation window), that is $71.9 million deployed into XRP by entities large enough to register as whales in Santiment’s tracking methodology — in four days, while BTC was falling from $79,000 toward $73,000. This is not passive holding. This is active buying into a macro downturn.
The combined on-chain read across all three assets presents a specific signal: large capital is rotating, not exiting. Bitcoin and Ethereum whales reduced exposure by a combined $2.64 billion in dollar terms. XRP whales added $72 million in the same window. The numbers are asymmetric, but the direction is not random.
Asset
Whale Action
Amount
Dollar Value
Timeframe
Bitcoin (BTC)
Selling / Distribution
−34,000 BTC
~$2.6B
Past 7 days
Ethereum (ETH)
Selling / Distribution
−17,800 ETH
~$40M
Past 7 days
XRP
Buying / Accumulation
+65.32M XRP
~$72M
Past 4 days
Source: Santiment, via @alicharts (X)
Whale accumulation is not a price guarantee. What it does confirm is that the entities with the largest on-chain footprints in XRP chose to increase their exposure precisely during the period that BTC fell $6,000. That is a timing signal — not a directional forecast.
The on-chain accumulation signal arrives against a less-than-supportive ETF backdrop. Data via SoSoValue shows XRP spot ETFs recorded a daily net outflow of $7.6 million on November 10, with five consecutive outflow days totaling $18.0 million over the past trading week. Total ETF net assets stand at $1.19 billion, with cumulative net inflows since launch at $1.79 billion.
The divergence between ETF outflows and whale on-chain accumulation is itself a data point. Institutional-wrapper investors (ETF buyers) reduced exposure. Direct on-chain large holders increased it. These two pools of capital are making opposite bets in the same week. Which signal proves prescient will depend heavily on what macro data delivers — Initial Jobless Claims land November 11, PPI (MoM) on November 12, and Core PCE alongside GDP on November 24, per FRED. Any of these prints moving in an unfavorable direction could extend the BTC/ETH whale selling pressure and test whether XRP’s on-chain accumulators hold conviction.
The Santiment data confirms wallet-level holdings changes. It does not confirm the identity of the wallets, the intent behind the trades, or whether the XRP accumulation represents fresh buying versus internal transfers between whale-controlled addresses. It also does not establish a price target for XRP.
What it does establish with specificity: 65.32 million XRP moved into whale wallets in four days while the broader market sold off. That is a measurable, quantified fact — not a sentiment reading or a momentum indicator. On-chain analytics infrastructure is expanding rapidly, and the granularity of signals like this one continues to improve.
At $1.063 with a $67.5 billion market cap and $2.23 billion in 24-hour trading volume, XRP’s immediate test is whether the whale accumulation translates into price support or simply cushions a continued decline. The 65.32M XRP figure — equivalent to roughly 32 days of average daily trading volume in a single four-day accumulation window — is the number traders should be watching alongside price.
Disclaimer: The views and analysis presented in this article are for informational purposes only and reflect the author’s perspective, not financial advice. Technical patterns and indicators discussed are subject to market volatility and may or may not yield the anticipated results. Investors are advised to exercise caution, conduct independent research, and make decisions aligned with their individual risk tolerance.
Also Read: ETH Hits the 0.618 Fib — An Analyst Calls It a Spot Buying Opportunity