BitcoinWorld Cardano Price Forecast: Bearish Indicators Signal Potential for Further ADA Decline Cardano’s ADA token is facing increasing bearish pressure as of March 14, 2025, with technical
BitcoinWorld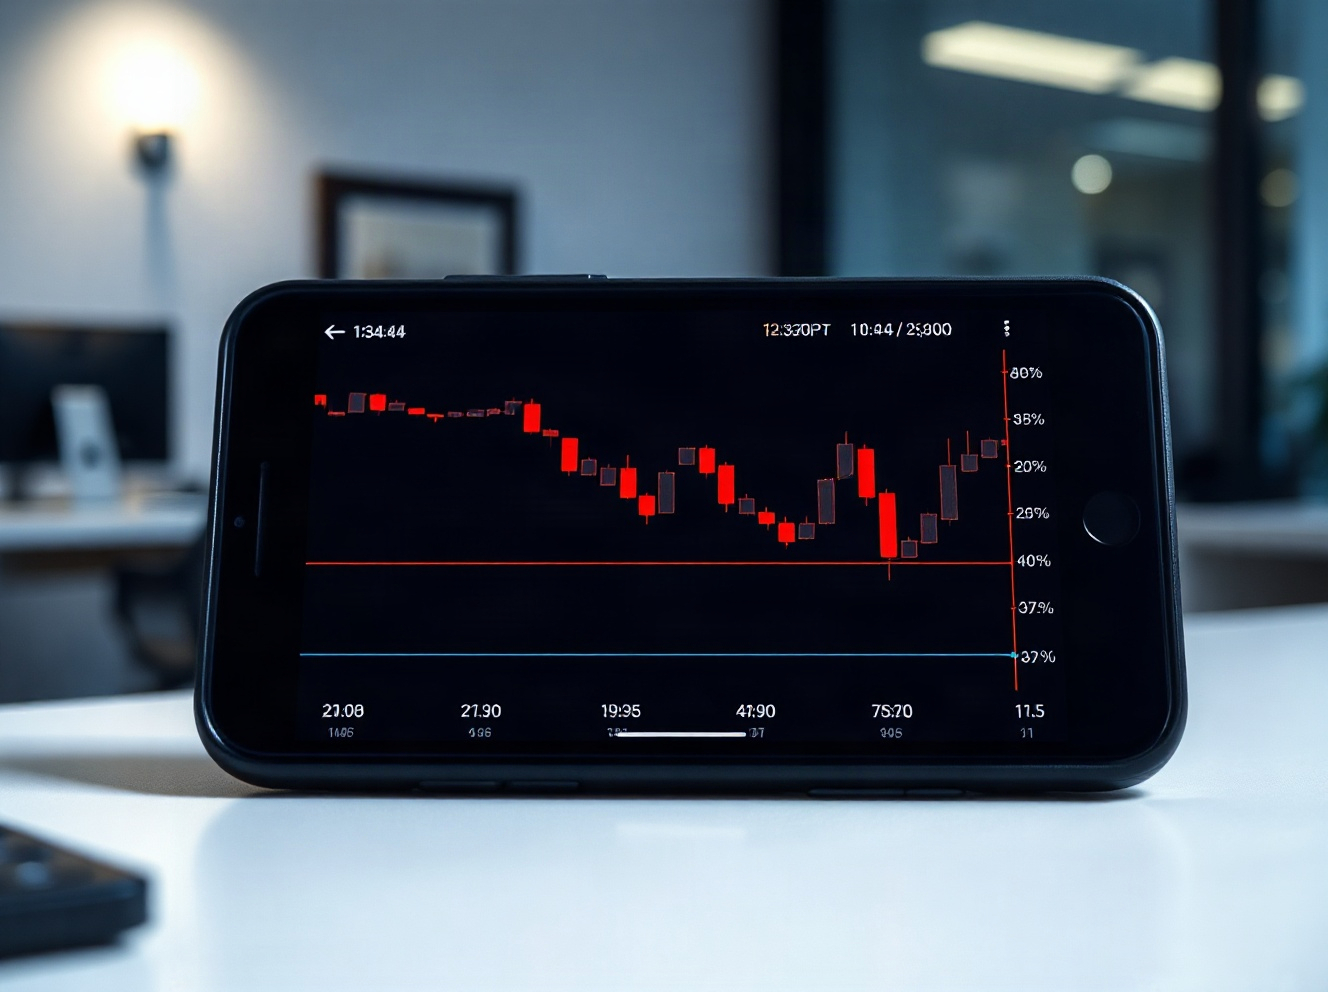 Cardano Price Forecast: Bearish Indicators Signal Potential for Further ADA Decline
Cardano’s ADA token is facing increasing bearish pressure as of March 14, 2025, with technical indicators pointing to a potential slide toward key support levels, according to recent market analysis.
What the Charts Show
Technical analysis of ADA’s price action reveals a series of lower highs and lower lows on the daily timeframe, a classic bearish pattern. The Relative Strength Index (RSI) is hovering near oversold territory, suggesting that while selling momentum is strong, a short-term bounce is possible. However, the overall trend remains downward, with the Moving Average Convergence Divergence (MACD) indicator showing a bearish crossover.
As of the latest data, ADA is trading around $0.32, down from its recent high of $0.40 earlier in the month. The next major support level is identified at $0.30, a psychological and technical level that has held in the past. If this level breaks, analysts warn of a further decline to $0.25.
Market Context and Broader Sentiment
The bearish outlook for Cardano is not isolated. The broader cryptocurrency market has been under pressure due to macroeconomic factors, including rising interest rates and regulatory uncertainties. Bitcoin and Ethereum have also seen significant pullbacks, which often drag altcoins like ADA lower.
On-chain data shows that large ADA holders, often referred to as “whales,” have been reducing their positions, adding to the selling pressure. Meanwhile, the network’s development activity continues, but positive fundamentals have not been enough to offset the negative market sentiment.
Why This Matters to Investors
For investors, understanding the technical and on-chain signals is crucial for risk management. A break below the $0.30 support could trigger further selling, but it may also present a buying opportunity for those who believe in Cardano’s long-term potential. As always, it’s important to conduct your own research and consider your risk tolerance before making any trading decisions.
Conclusion
Cardano’s price action currently reflects a bearish trend, with key technical indicators signaling the potential for deeper losses. While the market remains volatile, the next few days will be critical in determining whether ADA can hold its support levels or if further downside is imminent.
FAQs
Q1: What is the current price of Cardano (ADA)?As of March 14, 2025, ADA is trading around $0.32, down from its recent high of $0.40.
Q2: What are the key support levels for ADA?The immediate support is at $0.30, followed by $0.25 if the lower level fails to hold.
Q3: Why is Cardano price falling?The decline is attributed to broader market bearishness, technical chart patterns, and whale selling activity.
This post Cardano Price Forecast: Bearish Indicators Signal Potential for Further ADA Decline first appeared on BitcoinWorld.