One small-cap coin just ripped higher while most of the market sat still, and traders are trying to figure out if this is the start of something or just a loud exit. The Cat That Would Not St
One small-cap coin just ripped higher while most of the market sat still, and traders are trying to figure out if this is the start of something or just a loud exit.
The Cat That Would Not Stay Quiet
Cash Cat price prediction chatter picked up fast once CASHCAT started moving. The coin went from an afterthought to a top trending search in a matter of hours.
That kind of move gets attention. It also gets skepticism.
New tokens pump for all sorts of reasons, some good, some hollow. This one has a story behind it, and it is not the one you would guess first. It also comes while broaderaltcoin market moves have been choppy, which makes a standalone 24% candle stand out even more.
There is a trading incentive program running right now, and it is pulling volume into this coin from places that were not looking at it a week ago.
So is this a real trend forming, or a crowd chasing a reward pool that is about to close? That is the question worth sitting with before anyone hits buy.
What Happened
CASHCAT is trading near $0.075, up about 24.67% over the last 24 hours, according tolive CASHCAT market data pulled today. Volume jumped too, up 48.28% in the same window to roughly $33.53 million.
That is a big move for a token with a $75.45 million market cap.
And it did not happen quietly. On the 4-hour chart, price broke out of a tight base and is now pressing right into resistance near $0.0847.
That is the setup.
Why It Happened
Here's the thing: this pump lines up almost exactly with a live incentive campaign.Aster's grid trading announcement confirms a "Grid to Earn" promotion running through July 21, splitting $10,000 in $ASTER rewards among traders active in $ANSEM, $CASHCAT, and $CARDS grid pairs.
Grid trading rewards do not care about direction. They just reward activity. And that tends to inflate volume and price swings on smaller-cap tokens for the length of the campaign.
We pulled up the trading pair data ourselves, and the pattern was obvious. Volume started climbing right as the campaign got promoted harder on social media.
Turns out, incentive-driven volume can look exactly like organic demand, right up until the rewards stop.
Cash Cat Technical Analysis: The Evidence On The Chart
On the 4-hour timeframe, checking live crypto charting tools, CASHCAT is inside an ascending triangle. Higher lows are stacking up against a flat resistance ceiling near $0.0847, and price closed today around $0.075029, up 3.52% on that candle alone.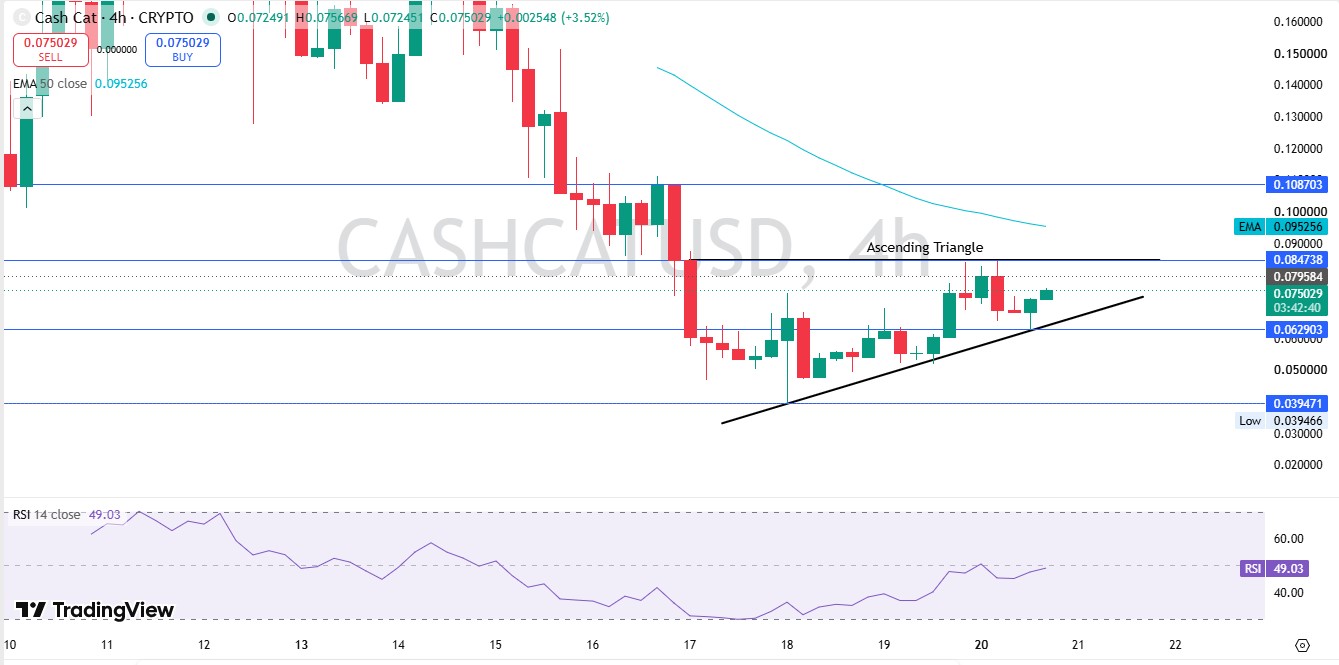
RSI, or relative strength index, a momentum gauge that reads overbought above 70 and oversold below 30, sits at 49.03. That is neutral. Not screaming with excitement, not exhausted either.
But the 50-period EMA, or exponential moving average, a trend line that weights recent prices more heavily, sits up at $0.095256, well above the current price. And it is sloped down.
That is the tension here. Short-term structure looks constructive. The longer trend line above still says caution.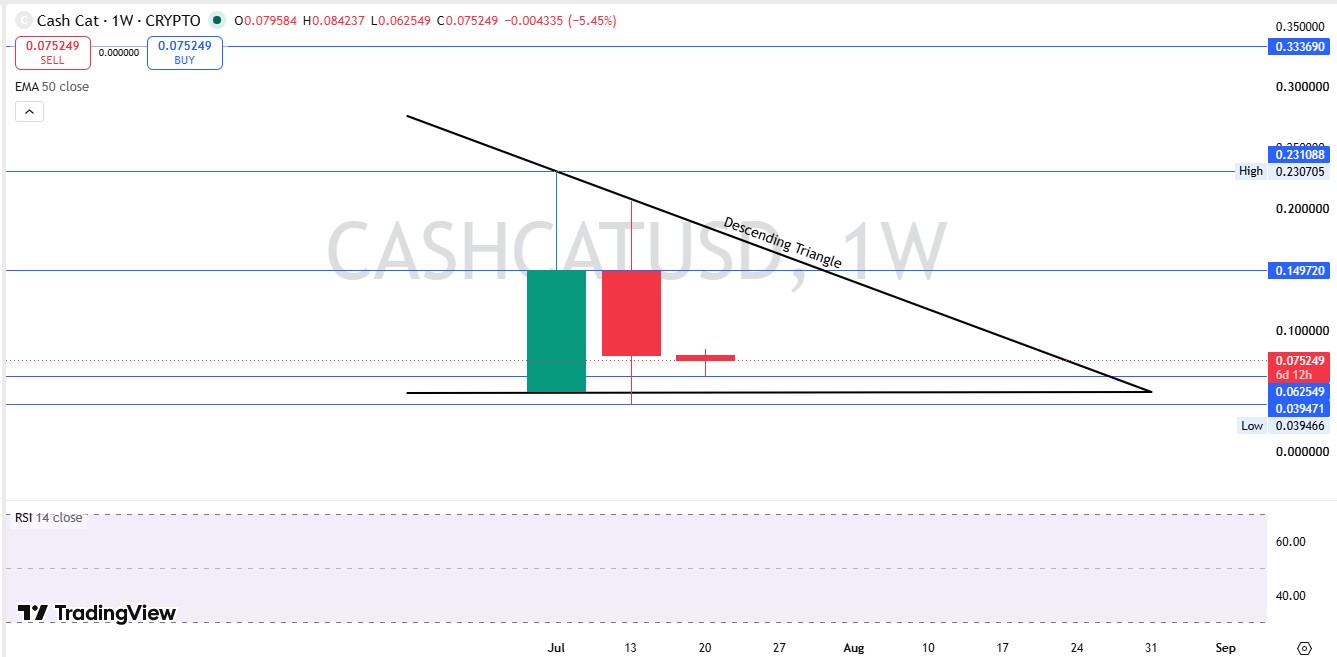
Zoom out to the weekly chart, and the picture gets heavier. This is a descending triangle, a pattern where lower highs press down against a flat support floor, and it usually resolves lower more often than not.
Weekly support sits at $0.062549. Weekly resistance up top is way higher, near $0.149720, with the all-time high zone around $0.2252 sitting far out of reach for now.
The chart does not lie.
What It Means For Price
Base case: CASHCAT likely tests $0.0847 again in the next day or two and possibly stretches toward the EMA50 near $0.095 if the Aster campaign volume holds through its final hours.
A clean close above $0.0847 on the 4-hour chart would be the first real signal that buyers are serious, not just farming rewards.
But a rejection there, especially once the campaign ends on July 21, is the more likely outcome given the weekly descending triangle still sitting overhead.
We would not chase this into resistance. Not yet. Moves like this are worth watching against the wider tape too, sincebitcoin price direction tends to set the tone for how far small-cap breakouts can actually run.
What Could Happen Next
If CASHCAT breaks and holds above $0.0847, the next magnet is the EMA50 at $0.095256, and above that, the weekly resistance zone is near $0.1497.
That is the bullish path. It requires volume to stay elevated after the reward program ends, which is the hard part.
And if it fails at resistance, the ascending triangle support near $0.0629 becomes the level to watch on the way back down.
Momentum can flip fast in either direction.
What Would Invalidate This
The bullish case falls apart on a daily close below $0.0629. That breaks the ascending triangle support and hands control back to sellers.
A deeper breakdown below $0.039471, the recent swing low, would put CASHCAT back near where this whole move started, and that would confirm the weekly descending triangle is still in charge.
Watch that $0.0629 line. It matters more than the resistance test does right now. It is a pattern we have seen play out across othertop memecoin trends once reward campaigns dry up.
Breaking: Reward Campaign Clock Is Ticking
Aster's Grid to Earn promotion closes July 21 at 10:00 UTC.
That is tomorrow.
Volume has been propping this move up. Once the incentive ends, that support may go with it.
Traders leaning on this pump should know the clock, not just the chart.
Token Snapshot
CASHCAT runs on the Robinhood Chain as an ERC-20 style token, with contract details visible on theRobinhood Chain token explorer, and a fully diluted valuation of $75.29 million, nearly matching its market cap since all 1 billion tokens are already in circulation. There is no looming unlock event to worry about here, at least not from the supply schedule.
Liquidity to market cap sits at 10.46%, which is on the lower side for a token this size. That thin liquidity is part of why price can swing so hard on relatively modest dollar volume.
CertiK, a blockchain security auditor, rates the contract 3.6 out of 5 stars. Not a red flag on its own, but worth knowing before sizing a position.
Holder counts differ by source. CoinMarketCap shows around 5,180 holders, while the Robinhood Chain explorer lists over 33,000 addresses holding the token, likely reflecting different counting methods or snapshot timing.
CASHCAT is still deep off its all-time high of $0.2252, set just nine days ago, and miles above its all-time low of $0.0007991 from July 1, a gain of more than 9,167% off that bottom.
That range alone tells you how volatile this thing has been. For more setups like this one, the fullcrypto price prediction hub tracks similar breakout and breakdown patterns across the market.
Disclaimer: This article is for informational purposes only and is not financial advice. Crypto markets are volatile, and small-cap tokens like CASHCAT carry elevated risk.