Chainlink price prediction is back in focus as LINK finds itself sitting right on top of a trendline that has already humbled buyers once before. The last time the price came anywhere close t
Chainlink price prediction is back in focus as LINK finds itself sitting right on top of a trendline that has already humbled buyers once before.
The last time the price came anywhere close to this exact zone, the reaction was violent enough to send the entire structure into a tailspin, and traders who were not paying attention got caught completely off guard.
Now LINK is back at the same doorstep, and the chart is quietly setting up for what could be one of the more decisive moves of the month.
Whether this turns into a fresh breakout story or another sharp rejection depends entirely on what happens over the next few candles. Here is the full picture.
Chainlink Price Today: Live Data and 24-Hour Change
LINK is trading at $11.337 at the time of writing, down 3.32%, a drop of $0.3892 over the past 24 hours.
Futures volume over the same period stands at $452.38 million while spot volume sits at $78.97 million, showing that derivatives activity is currently doing most of the heavy lifting.
Market cap is holding at $8.48 billion, open interest is at $627.20 million, and circulating supply is 748.09 million LINK out of a fixed total and max supply of 1.00 billion tokens.
Source: CoinGlass, August 29, 2026.
Chainlink Latest News and Catalyst
Fresh accumulation news is adding a layer of intrigue to this LINK price prediction.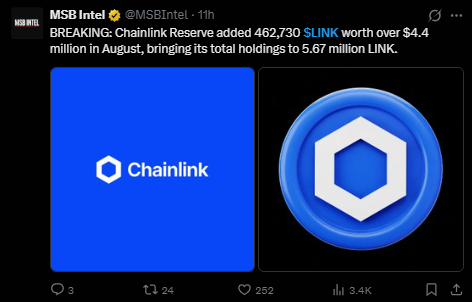
According to a report shared by MSB Intel, Chainlink Reserve added 462,730 sLINK worth more than 4.4 million dollars during August, pushing its total holdings up to 5.67 million LINK.
Reserve-style accumulation programs like this one are often read by the market as a signal of long-term confidence, even though they do not guarantee any immediate price reaction.
For now it adds a slightly bullish undertone to a chart that is otherwise sitting at a make-or-break level.
Source: MSB Intel on X, August 29, 2026.
Chainlink Liquidation Data and Market Positioning
Liquidation activity has skewed heavily toward longs over the past day, which lines up with the sharp pullback on the chart.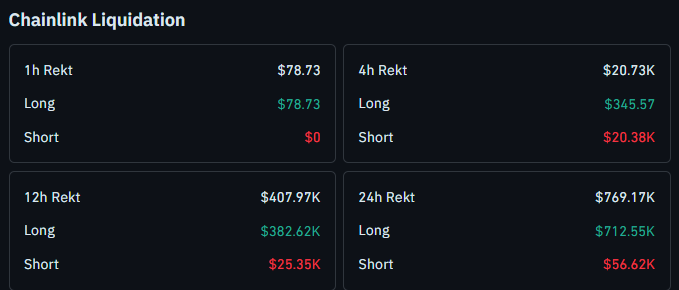
Over the last 24 hours, $769.17K in positions were wiped out, with $712.55K coming from longs against just $56.62K from shorts.
The 12-hour window tells a similar story: $407.97K total rekt, $382.62K of that from long positions versus $25.35K from shorts.
Zooming into the last 4 hours, $20.73K was liquidated overall, and shorts actually took the bigger hit here at $20.38K against a tiny $345.57 from longs, hinting that the most recent bounce briefly squeezed late short sellers before sellers regained control.
Source: CoinGlass liquidation data, August 29, 2026.
Quick Take
CMP: $11.337 on the 4-hour Binance perpetual chart
Bullish trigger: 4-hour close above $12.638 needed to confirm trendline breakout
Bullish continuation levels: $15.428, then $17.281
Bearish trigger: 4-hour close below $10.041 confirms the trendline breakdown
Bearish target on breakdown: $8.920
Data timestamp: August 29, 2026, 09:28 UTC+5:30
Risk note: LINK is trading right on a trendline that already produced one sharp rejection, so confirmation on a closing basis matters more than a simple wick through either level
Chainlink Technical Forecast August 2026
The 4-hour LINK/USDT perpetual chart on Binance shows the price currently resting on an ascending trendline that has been guiding this move since the middle of August.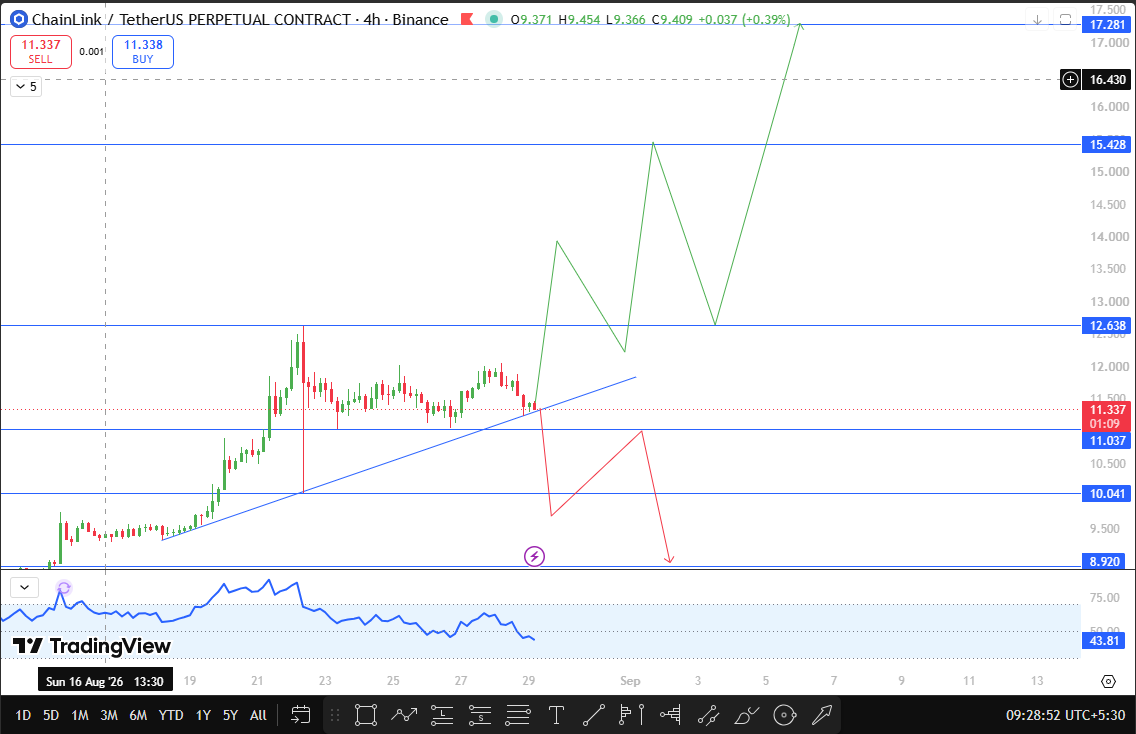
The first time LINK approached this exact trendline, it triggered a fairly aggressive rejection that dragged price down through several levels before buyers stepped back in.
That history matters here because it shows this is not a level the market is treating casually.
Right now LINK is attempting to hold this rising support again, and the setup from here is fairly binary.
If the trendline continues to hold and the price manages to close above $12.638 on the 4-hour chart, that would count as the first confirmation of strength.
A close beyond that level opens the door toward $15.428, and if momentum carries further, $17.281 becomes the next objective in play.
Both of these levels are marked from recent swing highs, so they are levels where sellers have shown up before and could show up again.
On the other side, if LINK fails to hold the trendline and closes below $10.041 on the 4-hour timeframe, that would mark a clean breakdown of the current structure.
In that scenario, the next meaningful support drops to $8.920, a level defined by a recent swing low.
Given how sharply LINK reacted the first time it tested this trendline, a similar reaction on this retest would not be surprising, so this is a level worth tracking closely over the coming sessions.
Source: TradingView, LINK/USDT Perpetual, 4-hour chart, Binance, August 29, 2026.
LINK Support and Resistance Levels
Level Type
Price
Note
Resistance 3
$17.281
Major upside target on extended breakout
Resistance 2
$15.428
Recent swing high
Resistance 1
$12.638
Confirmation level for trendline breakout
Current Price
$11.337
CMP on 4 hour chart
Support 1
$10.041
Trendline breakdown trigger
Support 2
$8.920
Recent swing low
Bull, Base, and Bear Case for LINK
In the bull case, LINK holds the ascending trendline, pushes through and closes above $12.638, and opens a path toward $15.428 with $17.281 as the extended target if buying pressure continues to build.
The base case has $LINK chopping around the trendline zone for a few more sessions without a clean close on either side, essentially consolidating while the market waits for a clearer signal.
In the bear case, the trendline gives way, LINK closes below $10.041, and the setup shifts toward a retest of $8.920, echoing the same kind of sharp move that followed the first rejection at this trendline.
Risks to This Chainlink Price Prediction
The biggest risk here is a repeat of the earlier rejection at this same trendline. Given how sharply $LINK reacted the first time, a similar move could unfold quickly and without much warning.
Broader market volatility, sudden shifts in Bitcoin and Ethereum price action, and changes in overall risk appetite across crypto markets could all override the technical picture outlined here.
This analysis is based purely on the current chart structure and available data, and conditions can change quickly in either direction.
Glossary
CMP: Current Market Price, the price at which an asset is trading right now.Trendline: A line drawn along a series of highs or lows to identify the general direction of price movement.Open Interest: The total number of outstanding derivative contracts that have not been settled.Liquidation: The forced closing of a leveraged position when losses exceed the trader's available margin.
Disclaimer
This article is for informational purposes only and should not be considered financial advice. Cryptocurrency markets are highly volatile, and readers should conduct their own research before making any investment decisions.