Cardano (ADA) is trading around $0.1664, up roughly 0.3% over the past 24 hours. Over the past day, ADA has traded within a relatively tight range between $0.1639 and $0.1701. Despite the rec
Cardano (ADA) is trading around $0.1664, up roughly 0.3% over the past 24 hours. Over the past day, ADA has traded within a relatively tight range between $0.1639 and $0.1701.
Despite the recent recovery attempt, the recovery chances remain mixed. The daily market data shows ADA is still down from levels seen earlier in the year.
Buyers have managed to stabilize price above the mid-$0.16 region, but the charts show that Cardano has reached an important decision point heading into the remainder of the summer.
Cardano Chart Analysis: Key Levels ADA Must Hold This Summer
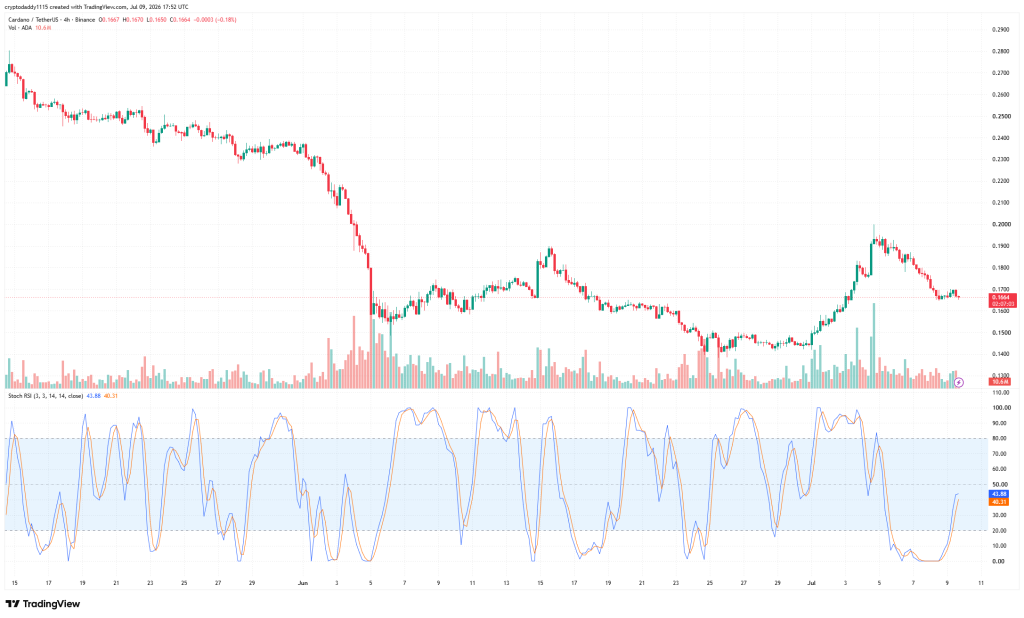
The 4-hour TradingView chart shows three distinct phases: a prolonged downtrend, a capitulation selloff, and a rising recovery attempt.
The dominant trend from mid-May into late June remained decisively bearish. ADA steadily dropped from above $0.27 before dropping sharply lower in early June. That high-volume breakdown caused the first major support zone that continues to decide Cardano’s structure today.
Cardano Price Chart: TradingView
Immediate Support: $0.160-$0.163 – This is currently ADA’s most important support. The chart shows multiple reactions in this area: early June stabilization after the capitulation decline, mid-to-late June consolidation, and current price finding buyers near $0.166 after rejecting higher prices. If ADA loses this zone, downside pressure could quickly return.
Secondary Support: $0.150-$0.153 – The late-June lows formed near $0.15 and created the next major demand zone. This level is previous swing lows, strong buying interest after weeks of selling, and the last meaningful technical floor before the market could revisit the $0.14 region.
First Resistance: $0.175-$0.180 – The July rally stalled repeatedly near this region before finally breaking higher. That makes $0.175-$0.18 the first resistance that bulls need to reclaim convincingly. Holding above this level would confirm that recent selling was merely profit-taking rather than the beginning of another leg lower.
Major Resistance: $0.190-$0.200 – This remains the key breakout zone. Price surged into this area during the first week of July, but heavy selling immediately surfaced. Those characteristics typically show quick profit-taking rather than sustained institutional accumulation.
Volume Analysis – Volume offers another important clue. The largest volume spikes appeared during the early-June capitulation and the rally toward $0.19. Since then, trading activity has gradually cooled during the pullback.
Overall, the technical analysis suggests Cardano has entered a consolidation phase rather than beginning a fresh downtrend.
Claude AI’s Cardano Price Prediction by End of Summer 2026
Based on the current chart structure and Cardano’s underlying fundamentals, the most likely outcome is a continuation of range-bound trading followed by another attempt to challenge the $0.20 resistance area.
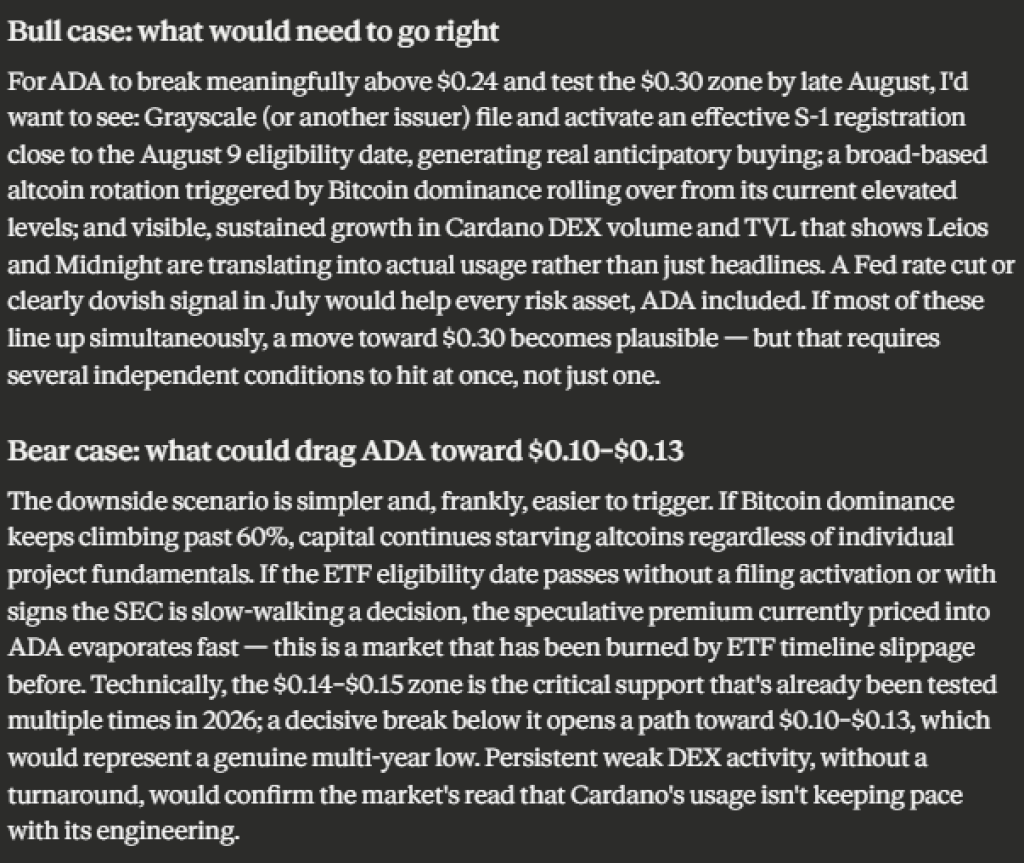
Claude AI predicts Cardano (ADA) price will close out August 31 trading in a $0.16 to $0.24 range, with a base case around $0.19 to $0.20. This is roughly flat to modestly higher than today’s price.
That’s a deliberately narrow range for a coin that’s been advertised as a $3, $10, even $100 asset in past cycles.
Claude Cardano Price Prediction
Bullish scenario: ADA successfully holds above $0.16, breaks through $0.18, and closes above $0.20, opening the path toward $0.22-$0.24 by the end of summer.
Base case: ADA continues consolidating between $0.16 and $0.20, finishing summer near $0.19-$0.21 as buyers gradually regain confidence.
Bearish scenario: Losing $0.16 shifts the attention back to sellers, exposing $0.15 first and potentially $0.14 if overall crypto markets weaken.
The evidence currently favors the base-case scenario. The recent correction appears orderly rather than impulsive.
Read Also: Cardano News: Hoskinson Slams Ethereum Circles
The Fundamentals Behind the Forecast: What’s Actually Driving ADA?
Technical charts explain where price is moving, but fundamentals explain why.
Network Development – Cardano remains one of the most actively researched proof-of-stake blockchains. Development continues to focus on scalability, governance improvements, and expanding smart contract capabilities.
The van Rossem hard fork (Protocol Version 11) shipped in mid-2026 and improved Plutus smart contract performance, and Ouroboros Leios entered public testnet phases like “Musashi Dojo” in late June. These are legitimate engineering milestones, but Cardano’s history shows technical upgrades tend to produce short-lived speculative pops.
Ecosystem Growth – The ecosystem continues to expand across decentralized finance, staking, identity solutions, and real-world blockchain applications. The Midnight privacy sidechain reached mainnet in the first half of the year. However, DEX activity on Minswap, SundaeSwap, and other native protocols has been volatile.
Market Liquidity – Like most large-cap altcoins, ADA remains highly sensitive to crypto market sentiment. Bitcoin dominance has climbed toward 56-58%, and the Fear & Greed Index has been pinned in “Extreme Fear” territory. Altcoins across the board have been starved of fresh capital as traders crowd into Bitcoin and Ethereum.
The ETF Calendar – CME launched regulated ADA futures on February 9, 2026, starting a mandatory six-month clock. On August 9, 2026, three weeks before the prediction date, ADA becomes eligible for a streamlined spot ETF review under the SEC’s generic listing standards.
Grayscale’s proposed “GADA” fund is the leading candidate to activate that filing. If it does, the SEC’s 75-day review window points to a final decision around late October 2026.
That means the actual approval decision almost certainly falls after August 31. What can happen before then is speculative front-running, but it’s sentiment-driven, not fundamentals-driven.
Our Final Take: Should You Be Buying, Holding, or Walking Away From ADA?
Cardano currently sits at a technically important inflection point.
The recent rally showed that buyers remain willing to accumulate ADA after months of weakness, but the rejection near $0.20 confirms that overhead supply still exists.
For existing holders, the current chart supports a hold stance as long as ADA remains above $0.16. That level has repeatedly lured buyers and now is the market’s primary technical line in the sand.
For new investors, patience may offer a better risk-reward profile. A confirmed breakout above $0.20 would strengthen the bullish case considerably. However, a pullback toward $0.15-$0.16 could present a more attractive entry if support remains intact.
Frequently Asked Questions
What is Claude AI’s exact price prediction for Cardano (ADA) by the end of summer 2026

Claude AI predicts ADA will trade in a $0.16 to $0.24 range by August 31, 2026, with a base-case target around $0.19–$0.20.
What key price levels should Cardano traders watch this summer
Traders should focus on $0.160–$0.163 as critical support: losing this zone opens the door to $0.15 and potentially $0.14.
What factors could push ADA above or below Claude’s predicted range
Upside catalysts: A spot ETF filing activation near the August 9 eligibility date (Grayscale’s “GADA” fund), a drop in Bitcoin dominance triggering an altcoin rotation, and visible growth in Cardano DEX volume and TVL from recent upgrades (Leios, Midnight). Downside risks: Bitcoin dominance climbing past 60%, the ETF eligibility date passing without a filing, or a decisive break below $0.15 support, which could send ADA toward $0.10–$0.13.
Subscribe to our YouTube channel for daily crypto updates, market insights, and expert analysis.
The post Claude AI Predicts Cardano (ADA) Price by the End of Summer 2026 appeared first on CaptainAltcoin.