ETH Price Analysis Ethereum did nearly everything bulls wanted to see—until it rally ran directly into a major wall of resistance. In this ETH price analysis, I'll examine structure, liquidit
ETH Price Analysis
Ethereum did nearly everything bulls wanted to see—until it rally ran directly into a major wall of resistance. In this ETH price analysis, I'll examine structure, liquidity, and order flow dynamics to gain insight into how ETH price is likely to develop in the near term.
The Foundation for a Breakout
The recovery began in June when ETH consolidated around $1,550 and established a new base of support.
In July, price reclaimed the broader market structure and eventually broke above it. Rather than immediately giving back the move, ETH spent the next four weeks consolidating near $1,875—exactly the kind of price action that can create a foundation for another leg higher. Then came the candle that made everyone question whether the bull market was back: a massive 31.4% weekly move.

ETH/USD weekly chart showing the June base, July structural reclaim, four-week consolidation and 31.4% breakout candle.
The Breakout Ran Into Structural Resistance
As impressive as that candle was, it carried ETH directly into the Timescape R/S Flip Line at $2,571.
That structural resistance level has now rejected price for three consecutive weeks. More importantly, it has close confluence with two of Ethereum’s most widely watched long-term moving averages: the 50-week and 200-week simple moving averages.
Any one of those levels could create resistance. Together, they form a much more consequential test.
ETH is no longer simply trying to extend a rally. It is attempting to reclaim a cluster of technical and structural resistance that could determine whether this move develops into a sustainable trend—or stalls beneath a long-term ceiling.
A Rare Death Cross Is Approaching
Making matters more uncomfortable for persistent Ethereum bulls, the 50-week SMA is approaching an imminent death cross with the 200-week SMA.
There is not much historical data to work with because this particular pattern has occurred only twice on Ethereum’s chart: once in 2015 and again in 2019.
In both cases, price moved lower after the cross.
A sample size of two is far too small to treat the pattern as a reliable prediction, and a death cross does not guarantee that history will repeat. It does, however, add another layer of risk at a time when ETH is already struggling beneath major resistance.
The signal deserves attention—but tonight’s weekly close should provide more useful information than the cross alone.
What to Watch at Tonight’s Close
The first question is whether $ETH can close above both the 50-week and 200-week SMAs.
A weekly close above those moving averages would be a meaningful sign of strength. It would demonstrate that buyers can absorb supply around a technically important area and would improve the probability of another attempt at the Timescape R/S Flip Line.
If ir does reclaim the moving averages, the next question becomes even more important:
Can ETH break and hold above the Timescape R/S Flip Line at $2,571?
A brief move above that level would not be enough. Bulls need to reclaim it on a closing basis and then validate the breakout by holding the level as support. Without that validation, another push above resistance could become little more than a liquidity grab or failed breakout.
A major clue could come from Trend Precognition. At tonight’s close, traders should watch for any new signals on either the daily or weekly chart that support—or contradict—the developing price structure.
Liquidity and Order Flow Favor Caution
At the moment, liquidity and order flow indicate a relatively low probability of an immediate breakout.
The FireCharts view shows where liquidity is concentrated and whether large buyers are stepping in with enough conviction to push ETH through the resistance overhead. At the time of writing, all active cohorts are selling. Until that behavior changes, order flow does not appear to confirm the bullish scenario suggested by the recent price surge.
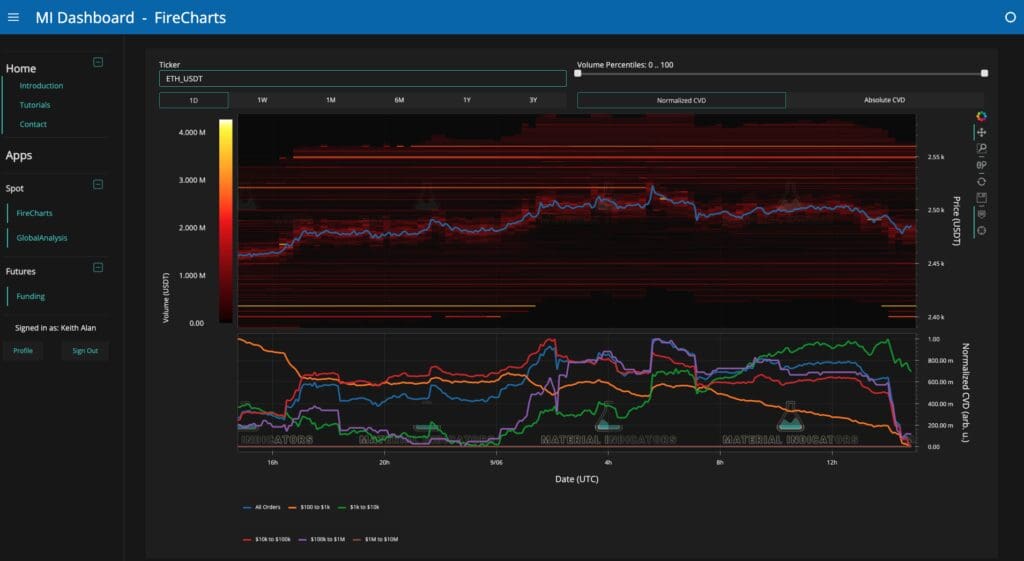
ETH/USDT FireCharts view showing the current liquidity landscape and order-flow conditions around the key resistance zone.
That does not mean a breakout is impossible. Crypto remains the Wild West—especially during a holiday weekend, when thinner liquidity can amplify volatility and produce unexpected moves in either direction.
Let the Close Provide the Evidence
Ethereum’s recovery has been constructive. It built a base, reclaimed structure, consolidated above it and delivered an explosive breakout candle.
But the rally has now reached the point where bullish momentum must translate into confirmation.
A weekly close above the 50-week and 200-week SMAs would be encouraging. A validated reclaim of the $2,571 Timescape R/S Flip Line would be even more significant. Another rejection, particularly alongside a new bearish Trend Precognition signal, would strengthen the case that ETH has reached a temporary—or potentially more consequential—ceiling.
For now, the chart is approaching a decision point.
Stay disciplined, avoid anticipating the outcome and let tonight’s close provide the evidence.