Key Highlights Ethereum (ETH) is trading near $1,752, outperforming most altcoins in recent weeks. ETH has bounced from the key $1,580 support zone, which previously sparked rallies of 149% a
Key Highlights
- Ethereum (ETH) is trading near $1,752, outperforming most altcoins in recent weeks.
- ETH has bounced from the key $1,580 support zone, which previously sparked rallies of 149% and 203%.
- The next major hurdle is $1,800–$1,850, with $2,000 as the next upside target.
- However, repeated tests of $1,580 could gradually weaken this crucial support level.
Ethereum has bounced from one of the most historically significant price levels on its chart — and the data behind that level’s track record is compelling enough to take seriously, even in a difficult broader market environment.
ETH Price at a Glance — July 9, 2026
Ethereum (ETH) is currently trading at $1,751.80, showing solid momentum with an 8.33% gain over the past 7 days and a 4.05% increase over the last 30 days. The token’s market capitalization stands at approximately $211.41 billion. After facing pressure in recent weeks, Ethereum has managed to stabilize and post consistent gains, outperforming many altcoins in the short term.
 Ethereum (ETH) Price on 09 July 2026/Source: Coinmarketcap
The $1,580 Level — Three Years of Historical Significance
Technical analyst @alicharts has identified the $1,580 zone as Ethereum’s most important long-term demand level — and the historical data supporting that classification is specific and verifiable.
Over the past three years, this exact price zone has functioned as a primary demand area — consistently stopping corrections and triggering substantial upward expansions rather than simply providing a temporary pause before further decline:
October 2023 — Ethereum tested the $1,580 zone during a broad market correction. Buyers defended the level and the subsequent recovery developed into a +149% macro rally — one of the most significant moves in ETH’s 2023–2024 cycle.
April 2025 — ETH revisited the same zone amid another corrective phase. Again, buyers stepped in at $1,580 and the resulting recovery produced a +203% price expansion — an even larger move than the 2023 instance from the same support level.
Recent action — 2026 — Ethereum bounced directly from the $1,580 area again in the most recent correction — and has since climbed back to test the $1,800 resistance range, where it sits right now at $1,751.80.
The same level. Three separate tests across three years. Two prior outcomes of +149% and +203% following confirmed bounces.
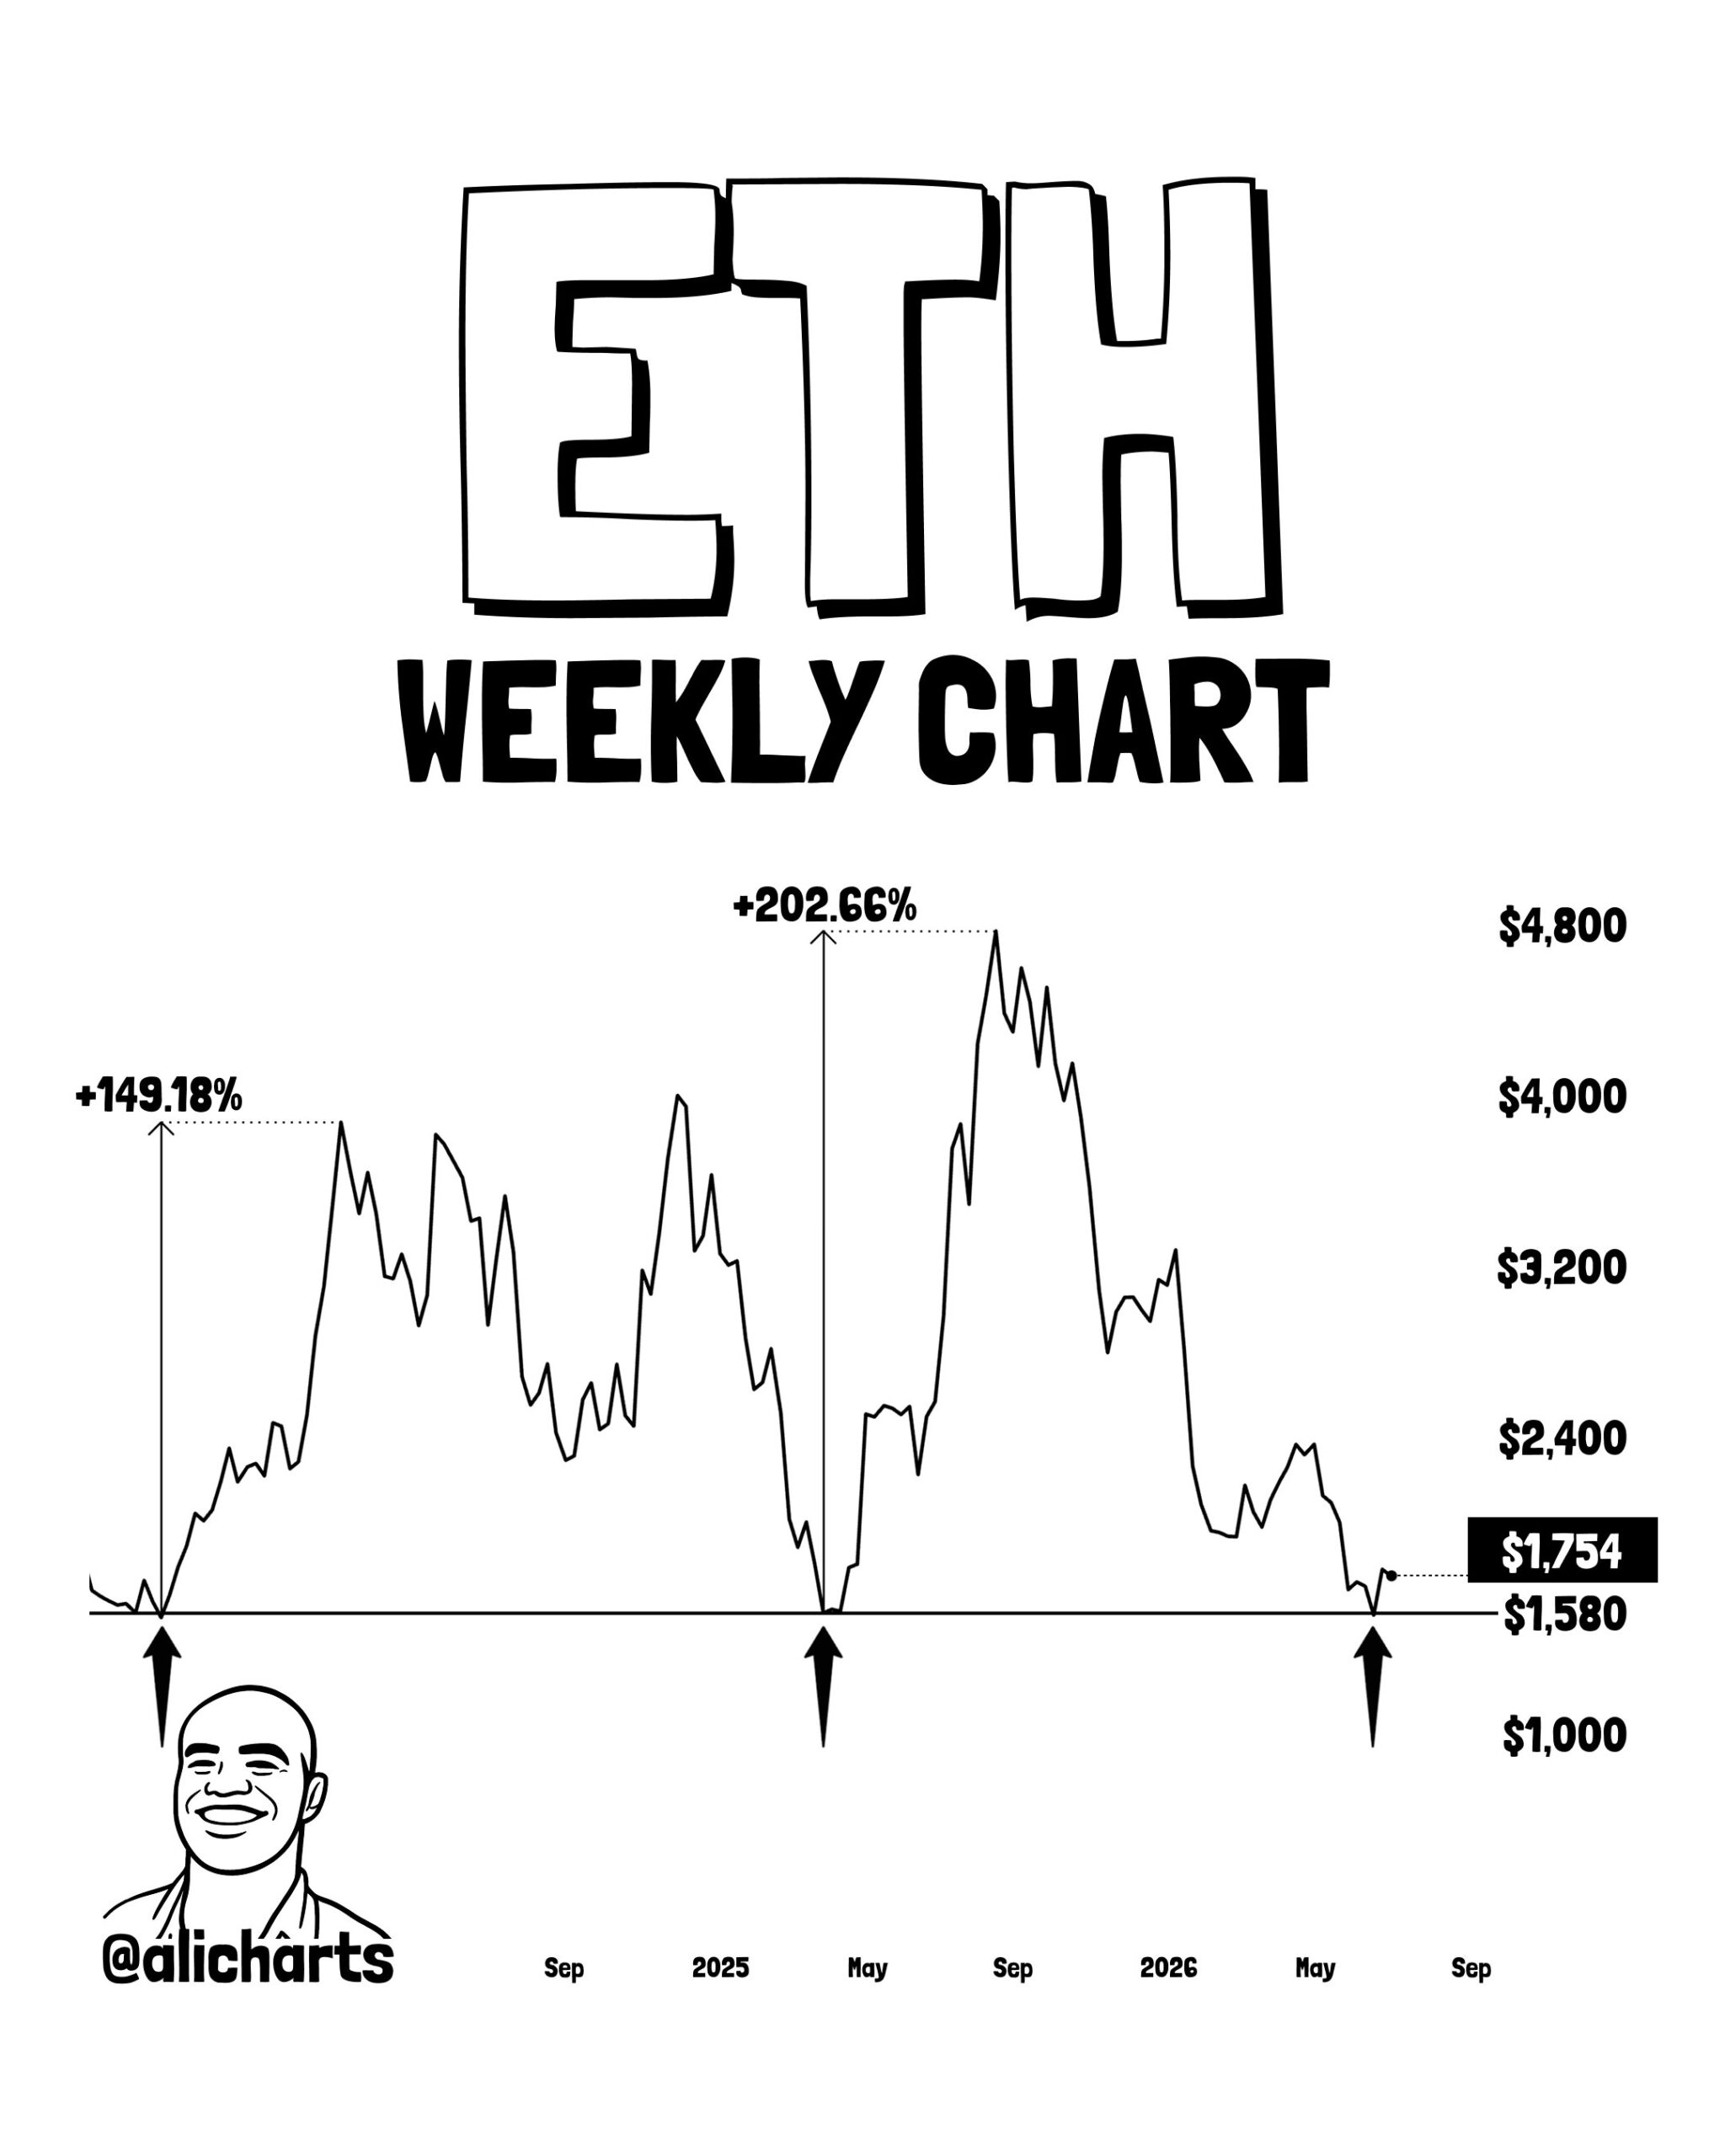 ETH Weekly Chart Holding $1580 Support/Source: @alicharts (X)
Why This Level Has Held — and Why It Gets Weaker Over Time
The $1,580 zone’s repeated defence reflects a specific market dynamic: it represents the price at which a substantial concentration of Ethereum buyers have historically been willing to step in with meaningful capital, creating a demand wall that absorbs selling pressure.
But there is an important structural caveat that @alicharts specifically flags: repeated tests of horizontal support levels gradually reduce buy-side liquidity at that zone over time.
This is a critical nuance worth understanding. Each time a support level is tested and holds, some portion of the buyers who defended it at that price have their orders filled — and they do not reappear at the same level again with the same size. The next test encounters a thinner order book than the prior one.
This does not mean the level will break — but it does mean that the third or fourth test of a support level is structurally more vulnerable than the first or second, even if price action looks similar on the surface. The $1,580 zone remains important, but each successive bounce from it carries slightly less defensive depth than the previous one.
This is why the current position — ETH at $1,751, already bounced from $1,580 and pushing toward $1,800 — is so significant. The goal now is to avoid giving the market another reason to retest $1,580 in the near term, because a fresh test would encounter a thinner buy-side than previous ones did.
The Current Setup — Bounce Confirmed, Resistance Ahead
With ETH having bounced from $1,580 and now trading at $1,751, the immediate market structure is constructive — but the next test is already visible: the $1,800–$1,850 resistance zone.
This level represents the upper boundary of the range ETH has been oscillating within during the current recovery. A clean, sustained break above $1,850 would be the first technical signal that the bounce from $1,580 is developing into something more substantial than a simple range-bound relief move.
The broader context makes this technically significant too. As we covered in our Ethereum monthly TD Sequential buy signal article — ETH printed a monthly TD Sequential buy for the first time since March 2025 at the start of July, a signal that has historically preceded +235% and +182% expansions from prior instances. The $1,580 bounce and the monthly TD Sequential buy arriving in the same period strengthen each other’s narrative.
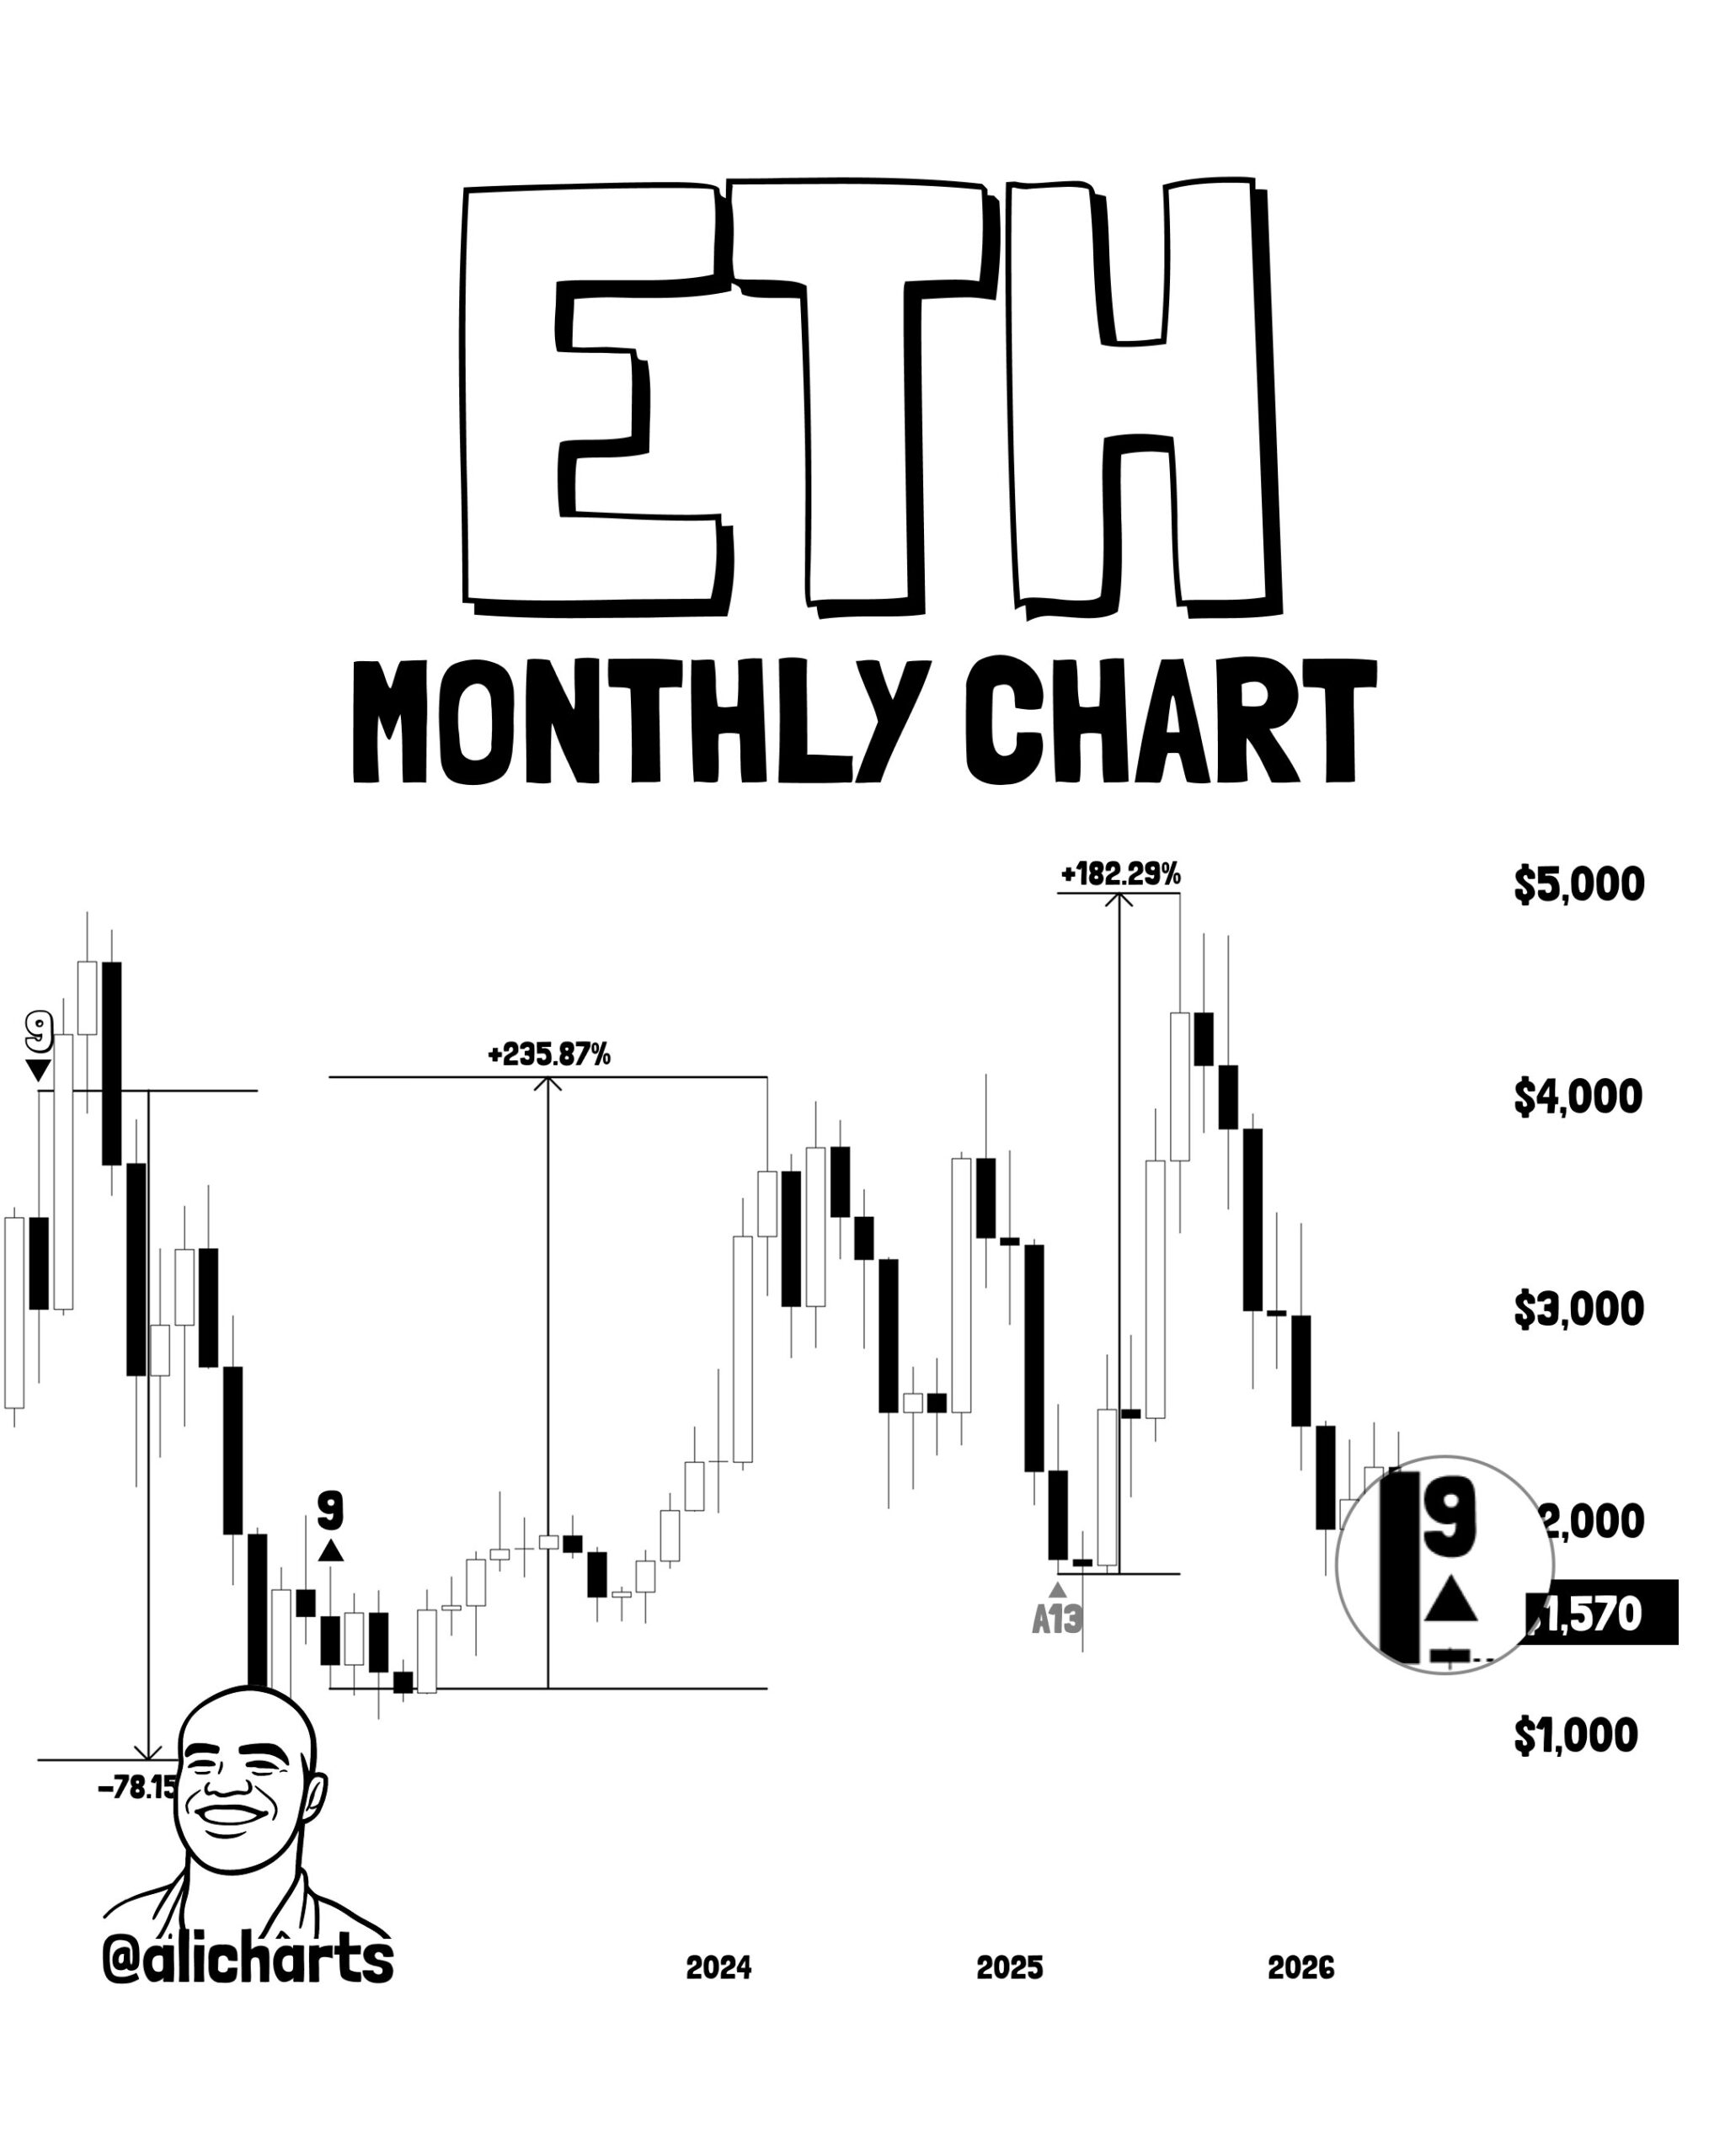 Ethereum (ETH) TD Sequential Buy Signal/Source: @alicharts (X)
And as we covered in our Lean Ethereum roadmap article — Vitalik Buterin’s July 4 announcement of the 2026–2030 protocol redesign adds a fundamental development catalyst to the technical picture. Recursive STARKs, post-quantum cryptography, 10x+ lower transaction costs, and native privacy are the kind of protocol improvements that historically shift long-term holder behaviour when the market is already at a technically significant inflection point.
Bullish Scenario — Break Above $1,800–$1,850
ETH sustains momentum above the current level and breaks through the $1,800–$1,850 resistance zone with conviction — confirming that the $1,580 bounce has genuine follow-through. The next target becomes the $2,000 psychological level — a price that would represent the clearest signal yet that the current recovery is developing into a sustained trend rather than another range-bound relief bounce.
Bearish Risk — Another Retest of $1,580
If ETH fails to clear $1,800–$1,850 and selling pressure returns, a fresh retest of the $1,580 zone becomes the risk scenario. Given the structural thinning of buy-side liquidity at that level with each successive test — a third major retest would face a thinner defensive order book than the October 2023 or April 2025 instances. A decisive daily close below $1,580 would structurally change the bullish thesis and open the door for deeper corrections.
Bottom Line
Ethereum’s $1,580 level is one of the most historically proven demand zones on its chart — a level whose two prior bounces produced +149% and +203% expansions. ETH has bounced from it again and is now pushing toward the $1,800–$1,850 resistance that will determine whether the current recovery has genuine continuation or needs to regroup.
The monthly TD Sequential buy signal, the Lean Ethereum protocol roadmap, and the $1,580 bounce all arriving within the same period create a genuinely multi-layered case for ETH. The key variable is whether buyers can defend the current momentum through the $1,800 resistance — because avoiding another $1,580 retest is as important as clearing resistance above.
Watch $1,800–$1,850 for the next directional signal, and watch $1,580 as the floor that must hold for the broader bullish thesis to remain structurally intact.
Disclaimer: The views and analysis presented in this article are for informational purposes only and reflect the author’s perspective, not financial advice. Technical patterns and indicators discussed are subject to market volatility and may or may not yield anticipated results. Investors are advised to exercise caution, conduct independent research, and make decisions aligned with their individual risk tolerance.