Around 140,000 ETH worth $350M left exchanges in 96 hours, potentially reducing available selling pressure. ETH faces resistance at $2,550-$2,650 after failing to sustain its rally, with $2,4
- Around 140,000 ETH worth $350M left exchanges in 96 hours, potentially reducing available selling pressure.
- ETH faces resistance at $2,550-$2,650 after failing to sustain its rally, with $2,450-$2,500 as key support.
- A break below $2,450 could expose $2,400, while renewed strength could push ETH toward $2,650 and higher.
Ethereum exchange withdrawals have reached roughly $350 million, while ETH struggles to hold gains above $2,500. Analyst Ali Charts reported that approximately 140,000 ETH left exchanges over 96 hours. Meanwhile, Michael van de Poppe highlighted Ethereum’s recent price recovery and linked its potential performance to developments surrounding the Clarity Act.
Ethereum Withdrawals Reach $350 Million
According to Ali Charts, investors withdrew around 140,000 ETH from exchanges during the past 96 hours. The withdrawn tokens had an estimated value of $350 million. Ali Charts said the movement suggests investors are choosing to hold Ethereum rather than trade it.
He also noted that lower exchange balances could reduce available selling pressure. However, the provided figures do not identify the exchanges involved or explain whether the withdrawals came from individual or institutional investors.
Michael van de Poppe also assessed Ethereum’s recent price action. He described a sharp upward move followed by a successful retest of support. According to van de Poppe, Ethereum could continue toward its previous highs. He added that the Clarity Act could support stronger performance against Bitcoin.
https://twitter.com/CryptoMichNL/status/2099441274440864082?s=20
ETH Exchange Flows Show Sharp Swings
The ETH spot inflow and outflow chart shows substantial changes between Sept. 10 and Sept. 15. Ethereum traded around $2,380 to $2,400 at the beginning of the period. The price later recovered toward $2,500 on Sept. 3.
However, ETH then moved sideways between approximately $2,450 and $2,520. On Sept. 10, the chart recorded two major negative netflows. One reached approximately negative $300 million, while another approached negative $290 million.
Ethereum also declined toward $2,400 to $2,420 during that session. The following day, netflows reversed sharply, reaching approximately positive $130 million.
Ethereum Faces Resistance After Sharp Recovery
The positive netflow on Sept. 11 coincided with Ethereum’s rise toward $2,650. However, the rally quickly lost strength, and ETH fell back toward $2,550. Between Sept. 12 and Sept. 14, netflows remained mostly positive.
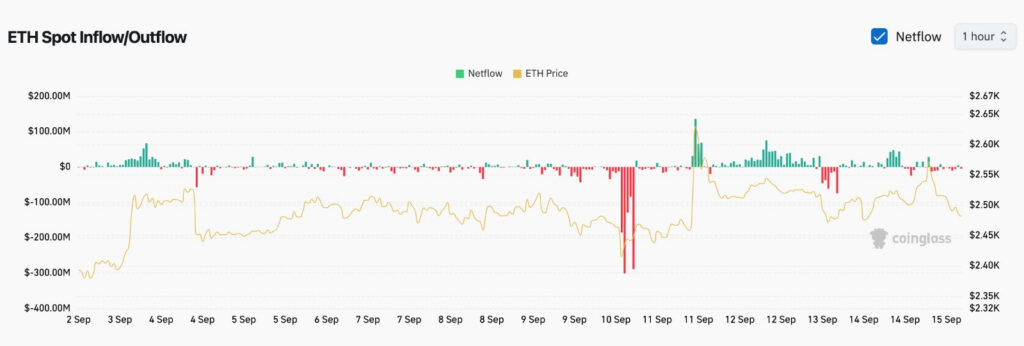
Source:
CoinglassSeveral readings ranged between $20 million and $50 million. Despite those inflows, Ethereum struggled to remain above $2,500. By Sept. 15, the price had declined toward approximately $2,470 to $2,480.
The chart identifies $2,450 to $2,500 as the main support area. A recovery could bring resistance near $2,550 to $2,650 into focus, while a break below $2,450 could expose $2,400.