Bitcoin and Ethereum enter the new week after one of the rougher stretches of October. BTC fell from the upper-$80,000s to an intraday low near $79,732 before recovering toward $81,800. Ether
Bitcoin and Ethereum enter the new week after one of the rougher stretches of October.
BTC fell from the upper-$80,000s to an intraday low near $79,732 before recovering toward $81,800. Ethereum was hit harder, dropping from the upper-$2,700s earlier in the month to a recent low around $2,313 before stabilizing near $2,416.
The selloff was not driven by one crypto-specific event. It came from a broader repricing of risk after hotter U.S. inflation, higher Treasury yields and renewed uncertainty over how aggressively the Federal Reserve may need to respond.
Last Week Left Crypto Damaged, but Not Broken
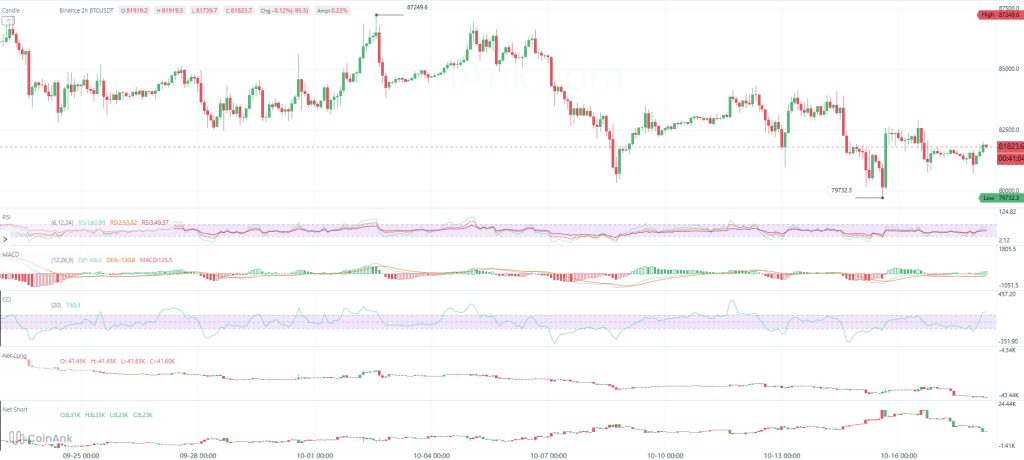
Bitcoin’s chart shows repeated failures around $83,000-$84,000 after the latest drop. Buyers did defend the sub-$80,000 area, but the rebound has so far lacked enough strength to recover the levels lost earlier in the week.
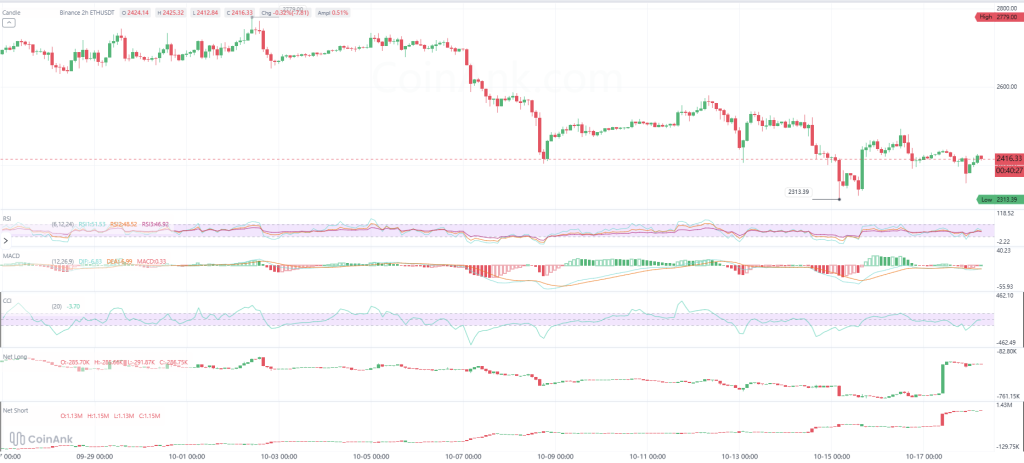
Ethereum followed a similar path, although with deeper percentage losses. ETH bounced from approximately $2,313 but remains trapped below the $2,500-$2,550 area that previously acted as support.
That relative weakness is important. ETH usually carries more beta than BTC, so when markets turn defensive, Ethereum can fall faster and rebound more slowly.
Crypto News Affecting Prices This Week
The biggest macro catalyst remains inflation.
September CPI rose 0.6% month over month and 3.7% year over year, above expectations. Core CPI also came in hotter than forecast. That immediately pushed markets to price a greater chance of another Fed increase, lifting Treasury yields and pressuring risk assets.
The second issue is the broader risk-off move in equities. Technology and AI-linked stocks were hit hard, with Asian markets also suffering deep losses. Crypto tends to struggle when investors are simultaneously reducing exposure to other high-volatility assets.
Fed communication is the third variable. Several officials later tempered expectations for an immediate October increase, which helped calm markets somewhat, but policy uncertainty remains high heading into the next FOMC meeting.
Bitcoin: Momentum Is Trying to Turn
I had a thorough look at the BTC/USDT two-hour Binance chart.
Bitcoin is near $81,824 after rebounding from $79,732.
 Source: CoinAnk
The RSI picture has improved considerably. Short RSI is near 61, medium RSI around 54 and the longer reading close to 50. That is one of the cleaner signs that buying pressure has returned.
MACD has also flipped positive. DIF remains negative near -68, but DEA is lower near -131, leaving the histogram positive around +125. That tells us momentum is recovering from a depressed base.
CCI around 150 confirms the same thing: BTC is seeing a strong short-term push.
The positioning data is less comfortable.
Net longs remain deeply negative around -41.6K, while net shorts are still positive near 8.2K. That shows the market is not fully convinced by the rebound yet.
The first recovery barrier is around $82,500-$83,000. Above that, $84,000-$85,000 becomes the zone that would begin repairing the broader structure.
Read also: BlackRock Sells Bitcoin AGAIN! (Numbers Are Worrying)
Ethereum: The Bounce Is Weaker and Positioning Is Heavier
Ethereum is trading near $2,416 after rebounding from $2,313.
 Source: CoinAnk
Its RSI readings are much less energetic than Bitcoin’s:
- short RSI: about 51.5
- medium RSI: about 48.5
- longer RSI: about 46.9
That puts ETH near neutral rather than clearly bullish.
MACD is almost flat. DIF is around -6.8, DEA near -7.0 and the histogram barely positive. This is more stabilization than momentum expansion.
CCI near -3.7 reinforces that idea.
The positioning chart is also worth watching. Net longs remain heavily negative around -286.8K, while net shorts have risen above 1.1 million. That leaves Ethereum more vulnerable to another downside move if support fails, although crowded shorts can also fuel a squeeze if price starts moving higher.
ETH needs to recover $2,450-$2,500 first. Above that, $2,550-$2,600 becomes the more important test.
Bitcoin and Ethereum Price Prediction for This Week
Asset
Bullish path
Neutral path
Bearish path
Bitcoin
Hold above $81K and clear $83K → $84K-$86K
$80K-$83K
Lose $79.7K → $78K-$79K
Ethereum
Reclaim $2,450-$2,500 → $2,550-$2,600
$2,350-$2,500
Lose $2,313 → $2,250-$2,300
Bitcoin currently has the cleaner short-term setup because momentum indicators have improved faster.
Ethereum is more fragile, but that also means any broad crypto rebound could produce a stronger percentage move if shorts begin covering.
The week probably comes down to whether BTC can turn $83,000 back into support. If it can, both assets have room to recover. If Bitcoin loses $80,000 again, Ethereum is likely to feel the pressure first.
For more crypto news and price predictions, click here.
Subscribe to our YouTube channel for daily crypto updates, market insights, and expert analysis.
The post Here’s Where Bitcoin and Ethereum Prices Might Go This Week appeared first on CaptainAltcoin.