HYPE is down 4.2% today, and honestly, this Hyperliquid price prediction lands at an awkward time for the chart. Price has pulled right into the tip of a triangle that's been building for wee
HYPE is down 4.2% today, and honestly, this Hyperliquid price prediction lands at an awkward time for the chart. Price has pulled right into the tip of a triangle that's been building for weeks.
No clean signal yet. Just a coin waiting to pick a direction, while Bitcoin and Ethereum decide the mood for everything else in the market, HYPEHYPE included, since it rarely moves on its own script.
HYPE Price Snapshot
$HYPE is currently trading at $60.24 right now, down 4.2% on the day after touching a low of $59.86 and a high of $63.35.
In BTC terms, it's off 5.4%, trading at 0.0009078 BTC, which is worth noting because when a token bleeds against BTC too, that's not just noise. 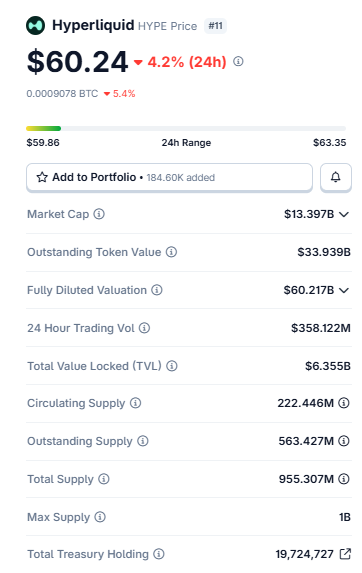
Source: Data Taken From CoinGecko as of 22/07/2026. Figures may vary slightly across other tracking websites.
Market cap sits at $13.397B. Fully diluted valuation is a much bigger $60.217B, and that gap matters; there's still a lot of supply left to hit the market.
The circulating supply is 222.446M out of a 955.307M total, capped at 1B max.
Trading volume over 24 hours came in at $358.122M. TVL, meanwhile, is holding steady at $6.355B, which tells you people haven't pulled money out of the protocol just because the price dipped.
Liquidation Heatmap: Longs Are Taking the Pain
Rough day if you were long. The liquidation heatmap shows $1.63M wiped out over 24 hours, and $1.26M of that came from long positions short.
liquidations were a much smaller $369.96K. Makes sense given the drop; anyone leveraged long got caught leaning the wrong way.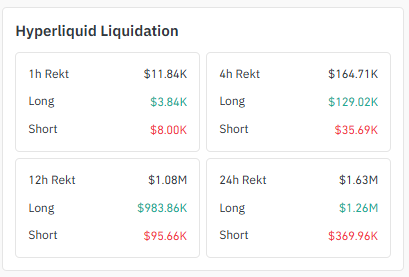
Source:Liquidation Data Taken From Coinglass.
Same pattern in the 12-hour window, actually worse in proportion: $1.08M total, $983.86K of it long.
The four-hour window shows $164.71K total, again mostly longs at $129.02K.
But zoom into just the last hour, and it flips a bit: $11.84K total, and this time shorts got hit harder at $8.00K versus $3.84K for longs. Small sign of a bounce trying to form, even if the bigger picture over the day still favors sellers.
Exchange Volume Heatmap
Binance is running the show on exchange volume with $449.02M. Right behind it, though, is Hyperliquid's own on-chain platform at $321.70M.
which is genuinely impressive for a native venue and worth flagging because it means liquidity isn't just parked on centralized exchanges.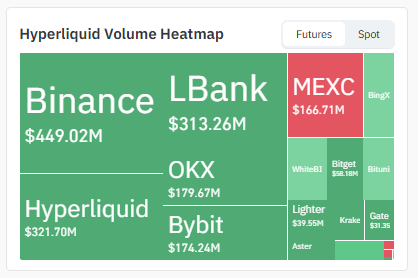
Source: Volume Heatmap Data Taken From Coinglass.
LBank comes in at $313.26M. OKX ($179.67M), Bybit ($174.24M), and MEXC ($166.71M) fill out the next tier, with smaller volume scattered across Bitget, WhiteBIT, Bituni, Lighter, Gate, Kraken, and Aster.
That native chain volume holding up during a red day says something about who's still trading HYPE where it actually lives.
Whale Watch: Multicoin Capital Takes Profit
$HYPE News Analysis: Something worth flagging from social chatter this week: Multicoin Capital, which quietly built a 606,091 HYPE position around five months back near the $30 mark, has started cashing out. 
Source: Data from the @BSCN account on x
Reports say the firm moved 395,570 HYPE (about $23.8 million) into Coinbase Prime and separately asked to unstake another 211,486 HYPE worth close to $13 million.
At current prices, that position is sitting on roughly $18.5 million in paper profit.
Early-investor profit-taking on this scale can add pressure on top of the technical support zone levels already in play, so it's not a detail to ignore.
4H Chart: Falling Trendline Fight
Shorter timeframe, same story in a smaller box. $HYPE has been fighting a falling trendline for a while now, and every bounce so far has run into it and turned back.
The price is under it currently, around $60.35.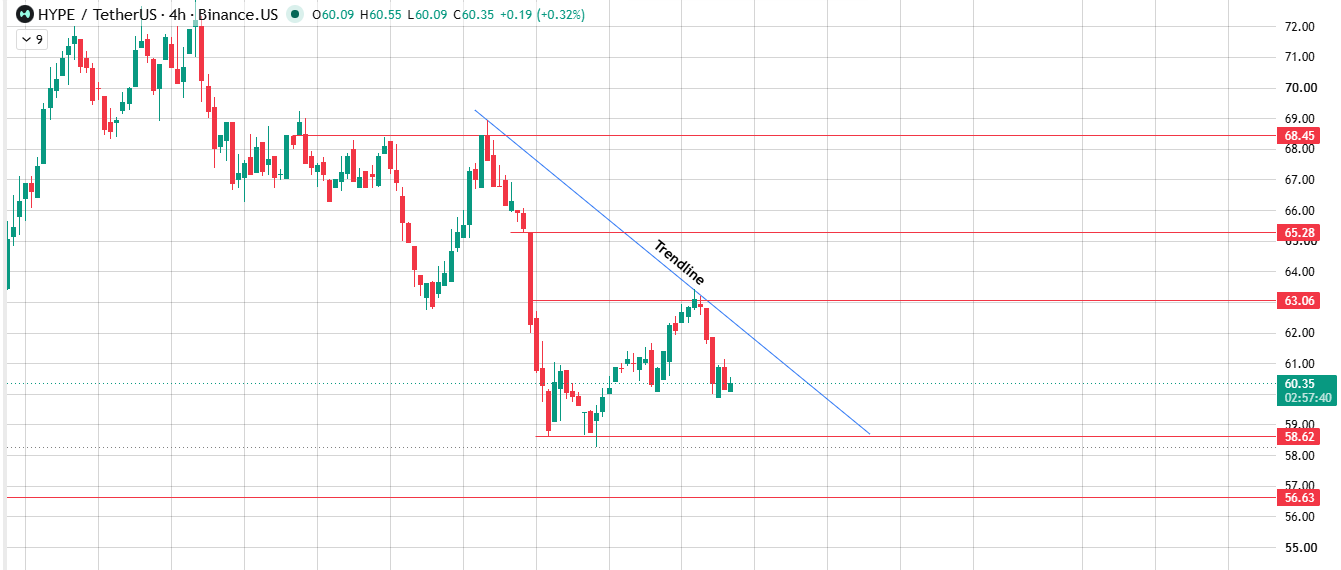
Source:Chart Taken From TradingView.
Get above that trendline, and $63.06 is the first target, then $65.28, then $68.45 if momentum actually carries.
Keep getting rejected off it, though, and $58.62 becomes the level to watch. Lose that and $56.63 is where things head next.
1D Chart: $HYPE Price Prediction The Triangle Squeeze
Pull up the daily chart, and you'll see it immediately: HYPE is boxed inside a symmetrical triangle, and price is sitting almost right on the apex.
These squeezes don't sit quiet for long. Something usually gives within a few sessions.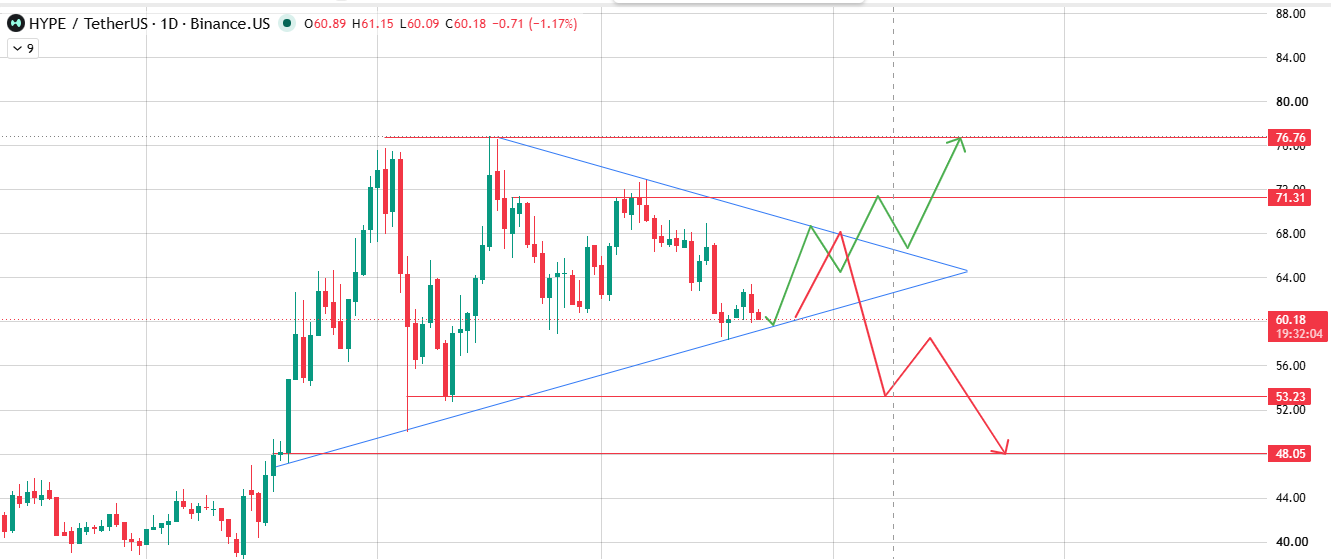
Source: Chart Taken From TradingView.
Break above and hold, and $71.31 is the first wall to test. Clear that convincingly and $76.76 opens up next.
Break below instead, and the first place buyers are likely to show up is $53.23; that's the support zone where a bounce attempt makes sense. If that fails and sellers keep leaning on it, $48.05 is next in line.
Three-Scenario Price Outlook
Nothing fancy here; every price target below is lifted straight off the 1D and 4H charts, no guesswork added.
ScenarioWhat Triggers ItNear-Term TargetExtended TargetBullish BreakoutThe triangle breaks up, and the 4H trendline is reclaimed.$71.31 / $63.06$76.76 / $68.45Range-Bound (Base Case)Price stays stuck between the triangle lines.$58.62 – $71.31Waiting on a clean breakBearish BreakdownThe triangle breaks down, and 4H support fails.$53.23 / $58.62$48.05 / $56.63
HYPE vs Other DeFi Tokens: Where It Stand
FactorHyperliquid (HYPE)Typical DeFi/Perp-DEX TokenSupply ModelCapped at 1B, with over 700M tokens still to unlockOften capped, but unlock schedules varyExchange LiquidityDeep liquidity across Binance, Hyperliquid's native chain, and LBankUsually thinner and more centralizedTVL Backing$6.355B locked in the protocolVaries widely by projectVolatility DriverBTC/ETH correlation plus whale flowsOften driven by narratives or incentive programs
What sets HYPE apart is really that native trading volume and the TVL sitting behind it. Most DeFi tokens don't carry that kind of liquidity base.
Glossary
Symmetrical Triangle: Basically, the price gets squeezed between two lines closing in on each other, one sloping down, one sloping up. Eventually it has to pick a side and break out.
Falling Trendline: Draw a line connecting the lower highs, and you've got this. Price keeps bumping into it and getting pushed back down until one day it doesn't.
Liquidation Heatmap: Shows you where leveraged traders are getting wiped out, whether long or short, and how much money went with them.
TVL (Total Value Locked): Simply how much money is parked inside a protocol right now. More TVL usually means more people trust it enough to leave funds there.
Methodology
This Hyperliquid price prediction draws on 1D and 4H HYPE/USDT chart data (Binance.US), liquidation numbers across the 1h/4h/12h/24h windows, exchange volume heatmap data, and live market stats as of July 22, 2026.
Every level mentioned above comes straight off the charted support, resistance, and trendline structure; nothing is extrapolated, nothing is guessed.
This piece is for information only, not financial advice.
Final Outlook
Bottom line for this Hyperliquid price prediction: HYPE is at a fork in the road. Break above the triangle and clear that falling trendline, and $63.06 followed by $71.31 come into play, with $76.76 further out if momentum really runs.
Break down instead, and $53.23 is the first stop, with $48.05 waiting if selling doesn't let up.
Add in Multicoin Capital booking profits and longs already bruised from recent liquidations, and this isn't a coin to trade on autopilot right now. Watch the levels, and keep half an eye on what BTC and ETH are doing too.
Disclaimer: This article is for informational purposes only and does not constitute financial advice. Cryptocurrency markets are highly volatile; always conduct independent research before making investment decisions.