Bittensor (TAO) changes hands at 228.10 US dollars, which leaves the token 54.2 percent below its twelve-month high of 497.94 US dollars from 2 November 2025. Measured from the other end of t
Bittensor (TAO) changes hands at 228.10 US dollars, which leaves the token 54.2 percent below its twelve-month high of 497.94 US dollars from 2 November 2025. Measured from the other end of the range the picture reads differently: the price stands 56.6 percent above the twelve-month low of 145.64 US dollars, dated 12 February 2026. Between those two poles sits the question: is Bittensor a good buy at current prices, after a recovery that has already run for six months?
cryptoticker.io collected the price data for this analysis on 25 August 2026, with market data from CoinMarketCap. The moving averages, the relative strength index and the distances to the twelve-month extremes were calculated in-house from 365 daily closing prices covering 25 August 2025 to 24 August 2026, plus the current quote, using standard formulas (exponential moving averages, RSI according to Wilder).
Bittensor price analysis: where the TAO price stands today
At 228.10 US dollars, Bittensor carries a market capitalisation of 2.57 billion US dollars and ranks 34th among all crypto assets. Circulating supply stands at 11.27 million TAO against a hard maximum of 21 million, so a little over half of all tokens that will ever exist are in the market.
Three marks frame the current zone. The 200-day average sits at 239.76 US dollars and runs 4.9 percent above the spot price, which turns it into the nearest overhead barrier. The 50-day average at 207.63 US dollars lies 9.9 percent below the price and has served as the floor of the summer advance. Below that, the twelve-month low of 145.64 US dollars is the level that would have to give way before the recovery could be called a failure.
The last 24 hours cost the token 5.8 percent, a normal daily swing at this size. Over seven days TAO is up 19.7 percent and over 30 days 15.8 percent, which shows that the price already carries a good deal of recent enthusiasm. Where the price bands could run from here is laid out in the Bittensor price prediction.
Is the Bittensor downtrend broken or only interrupted?
Over twelve months Bittensor is down 36.9 percent, and over 90 days it is still down 16.3 percent. Those two numbers describe the trend that has been in force since November 2025. The seven-day and 30-day gains describe something newer and much shorter.
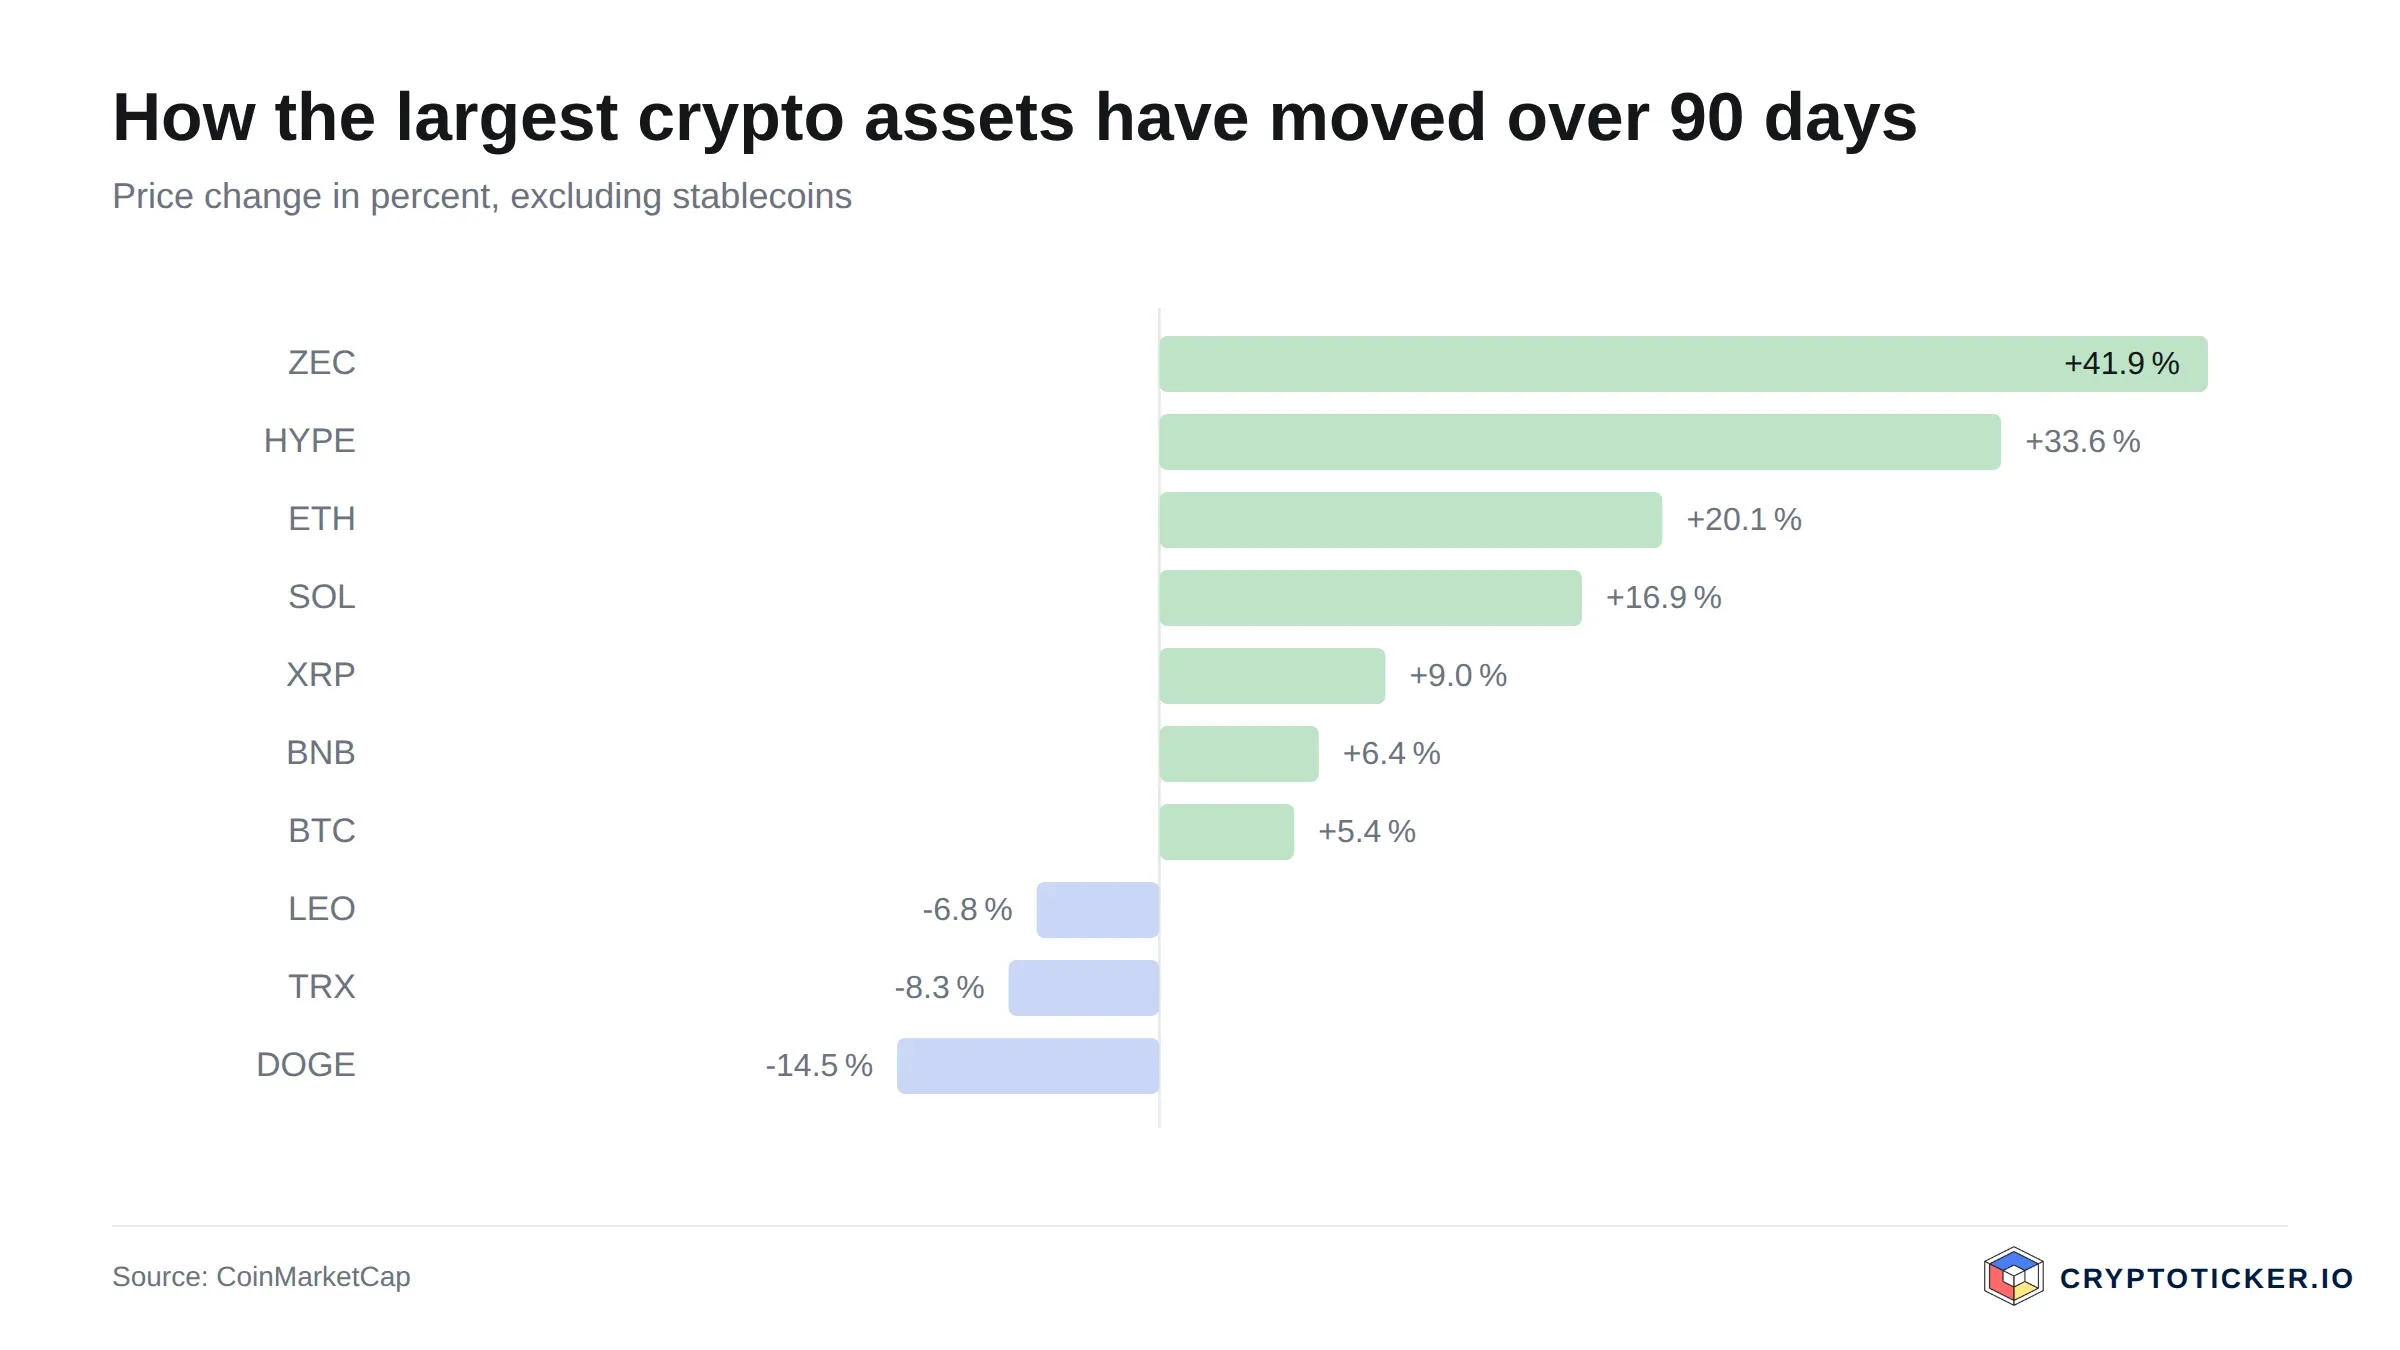
The largest crypto assets compared over 90 days, according to CoinMarketCap data
The technical test for a broken downtrend is straightforward: a market that has genuinely turned trades above its long-term average and holds there. Bittensor does not do that yet. At 228.10 US dollars the price sits below the 200-day average of 239.76 US dollars and has been below that line for most of the year. What has changed is the medium-term picture, where the 50-day line at 207.63 US dollars now runs beneath the price and has been rising since the February low.
The honest reading sits in between. The move off 145.64 US dollars is strong enough to be more than noise and not yet strong enough to be a trend reversal. A weekly close above 239.76 US dollars would be the first evidence that the twelve-month downtrend has ended. Until then the advance remains a counter-trend rally inside a larger decline, and it should be sized accordingly.
What RSI and moving averages mean for a TAO entry
The relative strength index over 14 days stands at 62.7, in the upper half of the scale without reaching the 70 mark conventionally read as overbought. For a buyer this is the least comfortable region of the indicator: momentum is clearly positive, so the cheap prices are gone, and there is no exhaustion signal that would argue for waiting either.
The relationship between the two averages carries more information than the RSI right now. The 50-day average at 207.63 US dollars remains 13.4 percent below the 200-day average at 239.76 US dollars. The bearish crossover from the winter has not been undone, and reversing it would take weeks of price stability above the current zone. Anyone buying Bittensor today is buying a chart whose long-term structure still points down and whose short-term structure points up.
The practical consequence is one of method. Staggered buying across several weeks captures the 50-day zone around 207.63 US dollars if the price returns to it, and it avoids committing a full position 4.9 percent below a barrier that has held all year.
What trading volume reveals about demand for Bittensor
Bittensor turned over 229.4 million US dollars in the past 24 hours, roughly 8.9 percent of its market capitalisation. That is a healthy ratio at this rank and means an ordinary position can be entered and exited without moving the price.
The trend in volume is the more useful signal. The seven-day average of 236.0 million US dollars stands well above the 30-day average of 139.2 million and above the twelve-month median of 163.8 million. Rising prices on rising volume indicate a rally with real buyers behind it rather than a thin drift upwards on an empty order book.
Elevated volume works in both directions. The same liquidity that carried the price 19.7 percent higher in a week is available to sellers, and the wider mood is stretched: the Fear and Greed Index stood at 80 points, in extreme greed territory, when this analysis was written. Such readings describe the present rather than forecasting the future, and they tend to accompany the later stages of a move.
Which structural factors speak for Bittensor
The supply mechanics are the clearest structural argument. TAO is capped at 21 million tokens and issued on a halving schedule, the design logic that the Bitcoin white paper set out for a predictable, declining rate of new issuance. With 11.27 million tokens in circulation, the share still to be released shrinks with every halving period, and steady demand meeting a slowing issuance rate is arithmetically favourable to holders.
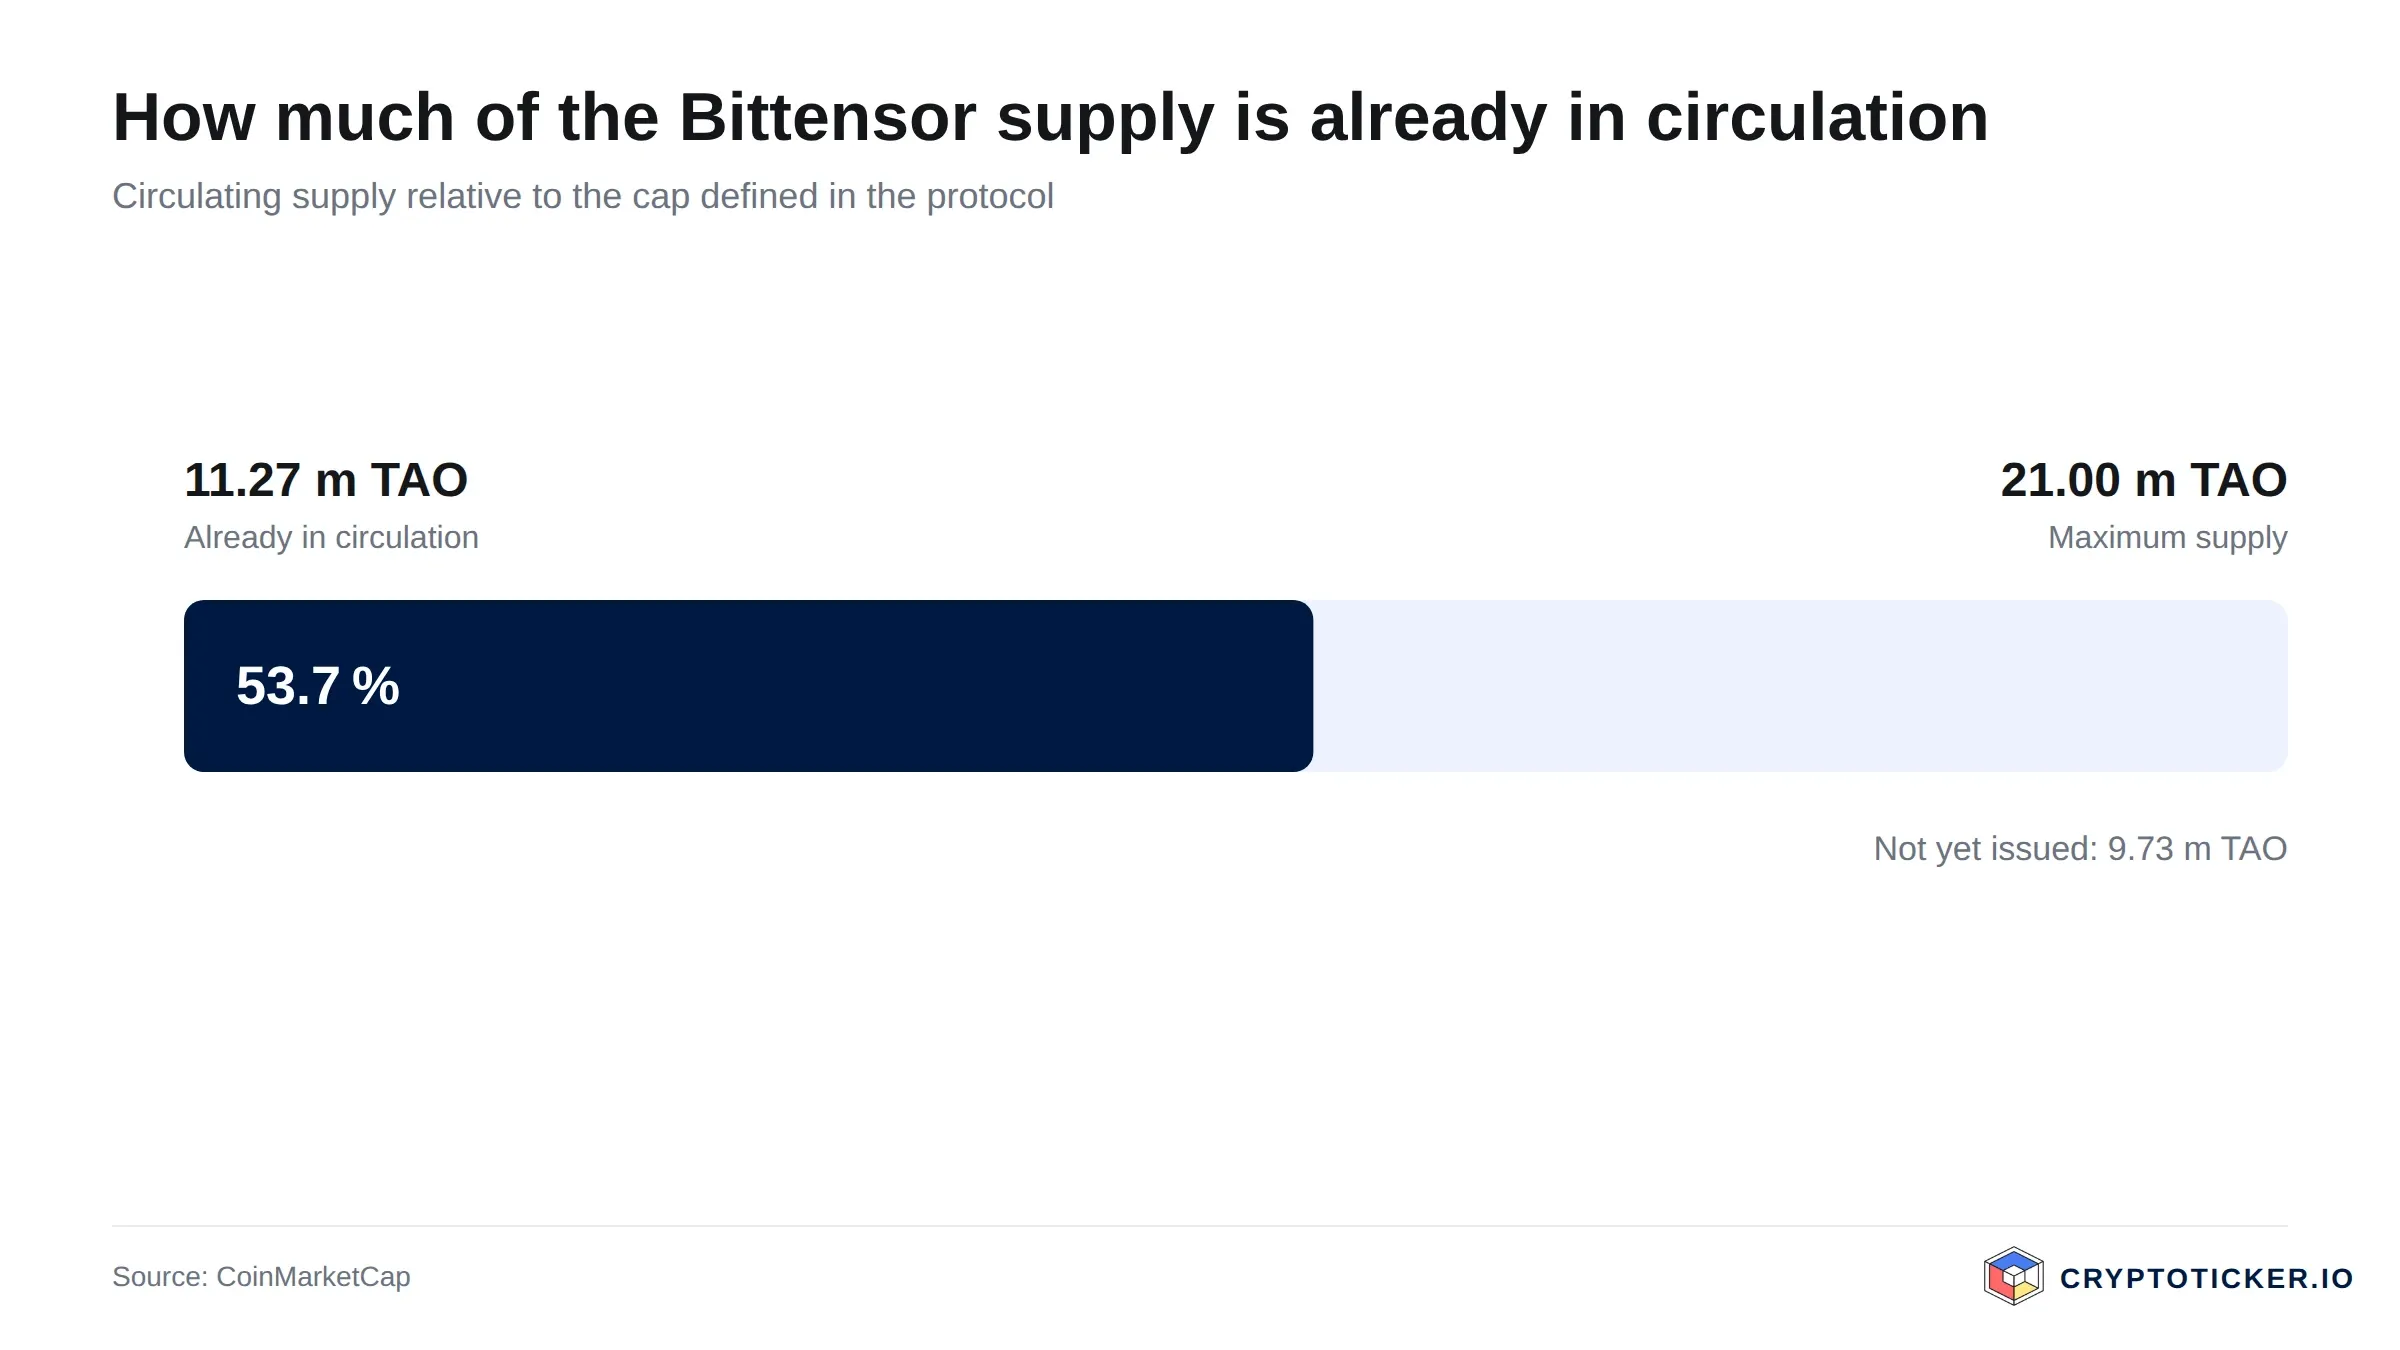
Bittensor supply structure according to CoinMarketCap data
The second factor is what the network is for. Bittensor organises subnets in which participants supply machine-learning work and are compensated in TAO according to how the network rates their contribution. The token therefore has a use inside the system beyond being traded. How much real demand that generates is an open question and should be treated as one.
The third factor is regulatory clarity in Europe. Under the EU crypto-asset regime supervised by ESMA, exchanges serving European customers need authorisation, and the disclosure and custody rules that come with it apply to TAO as to other crypto assets. That framework does nothing for the price, and it removes one category of risk that used to sit between European buyers and smaller tokens.
What speaks for buying Bittensor at current prices
Three arguments carry weight at 228.10 US dollars.
The price is still 54.2 percent below its high. An entry at this level is not an entry at a peak. If the 497.94 US dollar area is ever revisited, the distance from here is substantial, and the risk of buying into the last leg of a completed advance is lower than it was in November 2025.
The medium-term trend has turned. The 50-day average at 207.63 US dollars is rising and sits below the price, the twelve-month low of 145.64 US dollars is 56.6 percent away, and volume has expanded alongside the move. Those three conditions together are what a recovery looks like in its early phase.
The supply side is predictable. A hard cap of 21 million tokens with a halving schedule removes the dilution risk that affects assets with open-ended issuance. The AI narrative that drives interest in the sector can be volatile, and the issuance schedule underneath it does not change with sentiment.
What speaks against buying Bittensor at current prices
Three arguments cut the other way, and none is weaker than those above.
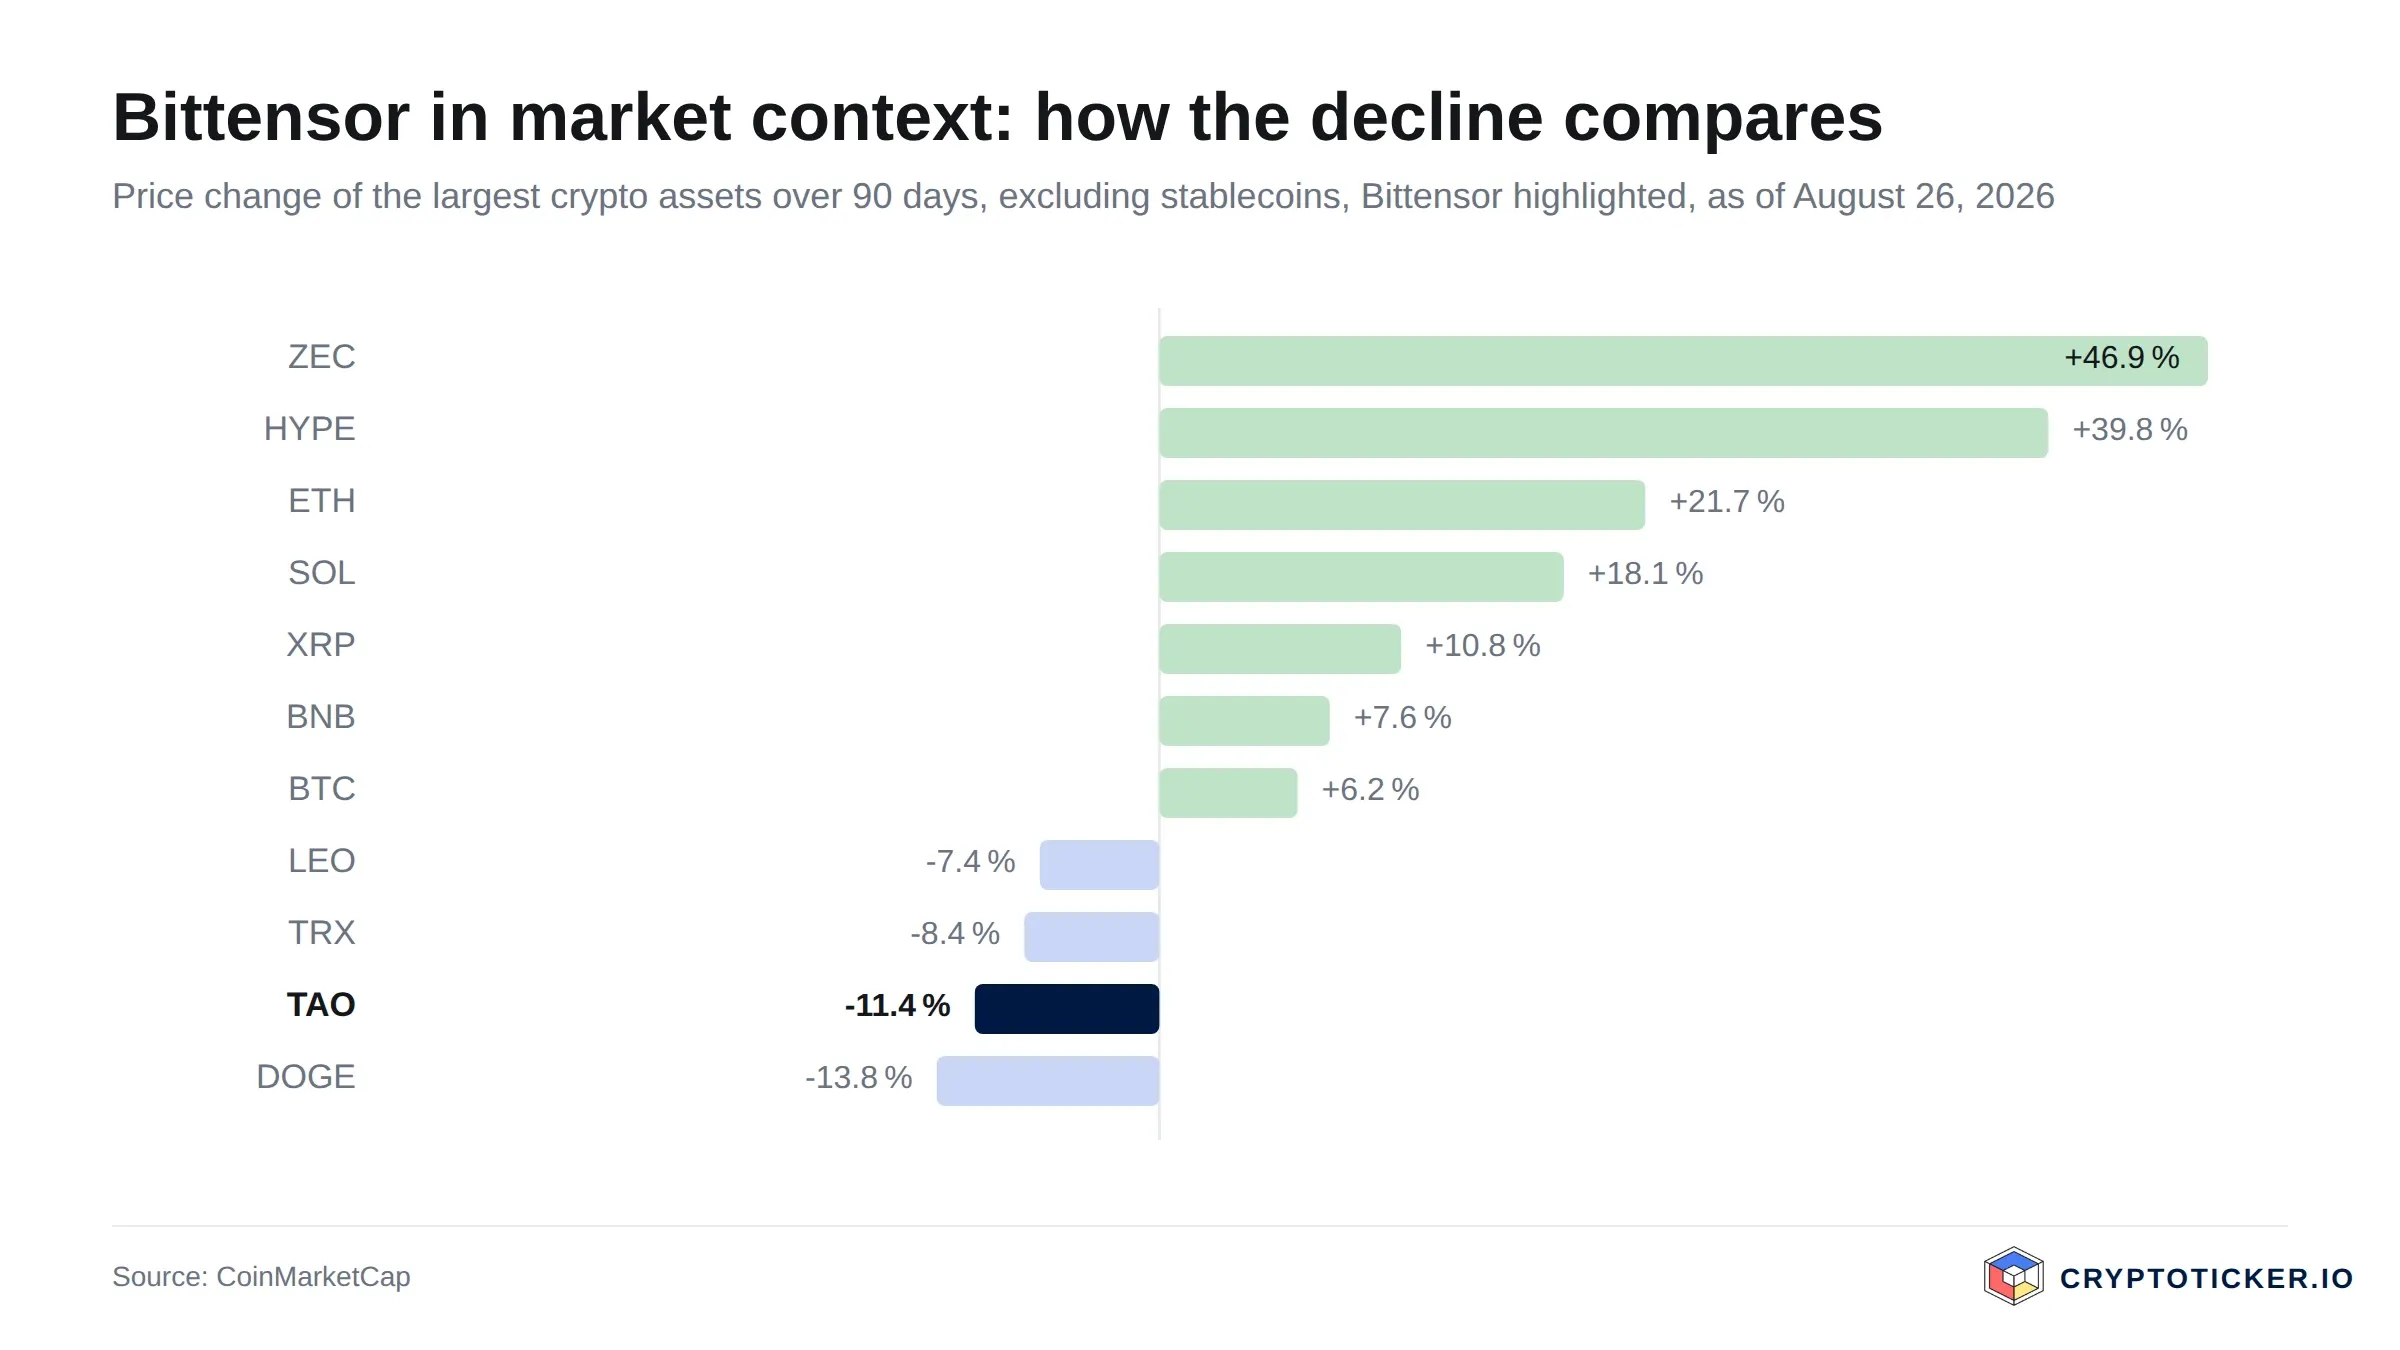
Bittensor compared with the other large crypto assets over 90 days
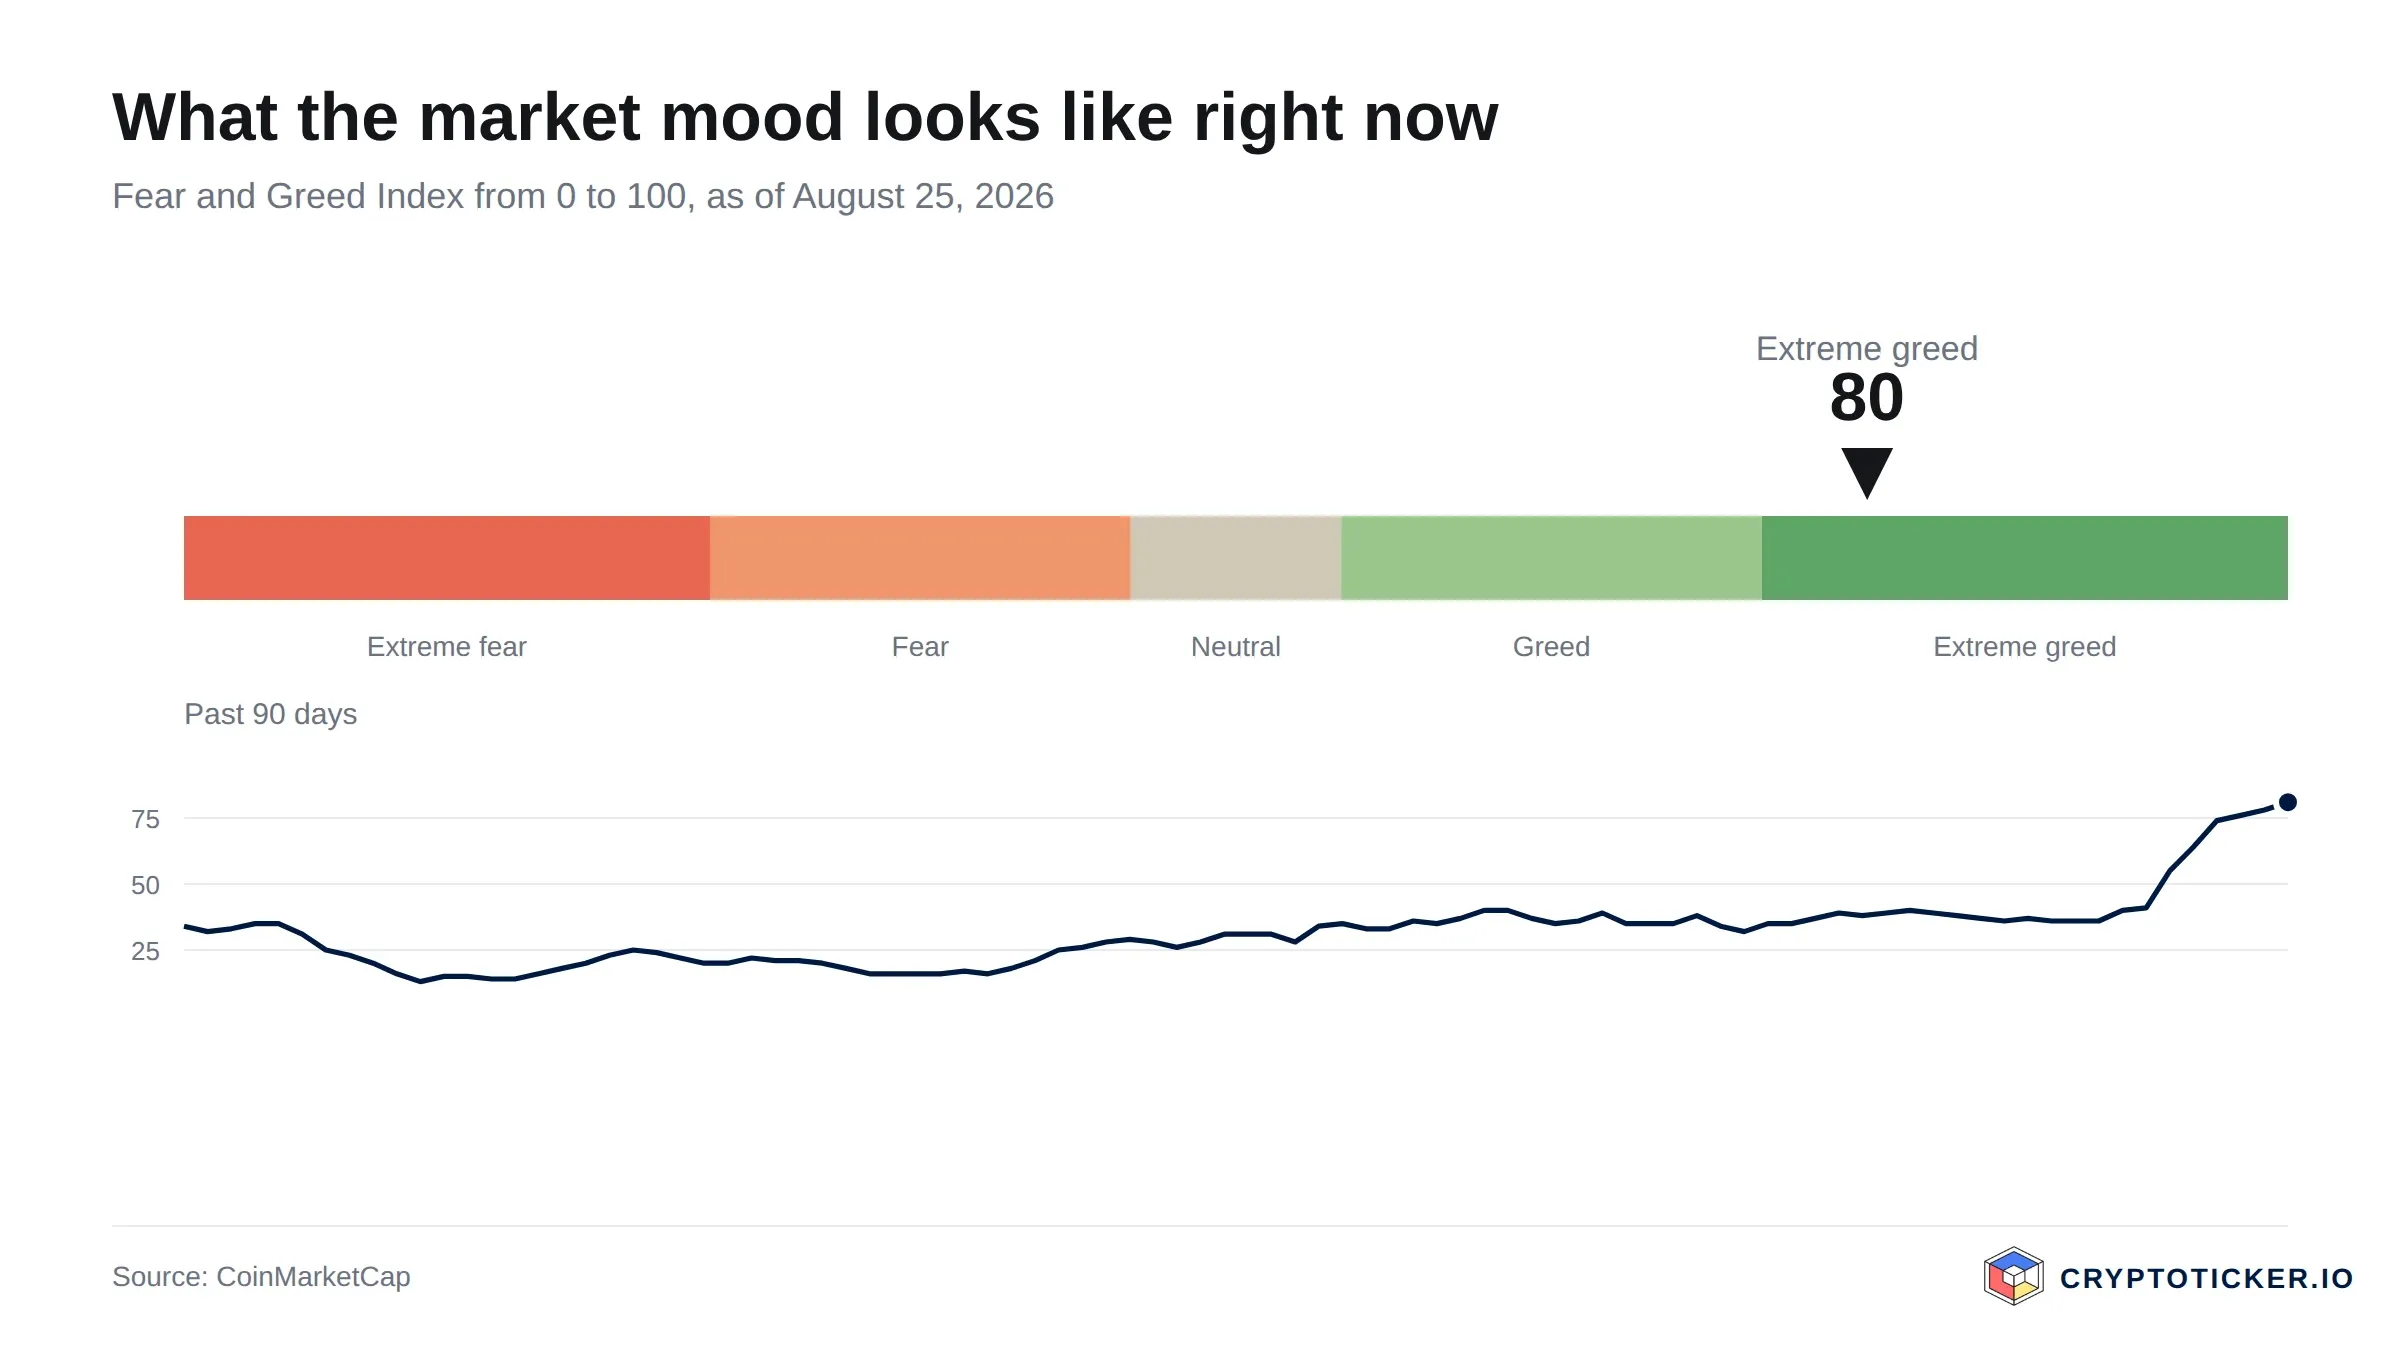
The Fear and Greed Index places market sentiment between extreme fear and extreme greed
The long-term trend is intact and it points down. TAO is 36.9 percent lower than a year ago and 16.3 percent lower than three months ago. The price remains below the 200-day average of 239.76 US dollars, and the 50-day average is still 13.4 percent beneath that line. Buying here means buying against the dominant trend and expecting it to change.
The move is already well advanced. A 19.7 percent gain in seven days and 15.8 percent in 30 days means the recovery has been priced in to a considerable degree. With the RSI at 62.7 and the market mood at 80 points on the Fear and Greed scale, the probability of buying shortly before a consolidation is higher than it was at 180 or 190 US dollars.
The valuation rests on a narrative that can reprice quickly. Interest in AI-linked tokens has driven the sector this summer, and such narratives have historically compressed as fast as they expanded. If capital rotates away, a market capitalisation of 2.57 billion US dollars would be tested against network revenue rather than expectations.
How to buy Bittensor (TAO) at current prices
TAO is listed on most large exchanges, though not on every European broker, so the venue question is worth settling first. Regulated European platforms such as Bitpanda or Kraken cover the usual payment routes; fee structures differ enough to matter for a staggered purchase, and the exchange comparison sets them side by side. Buyers who want authorisation status as a filter can start from the overview of regulated exchanges.
Costs come in three parts: the trading fee, typically between 0.1 and 1.5 percent depending on venue and order type, the spread between bid and ask, which is modest for a token with 229.4 million US dollars in daily turnover, and the withdrawal fee if the tokens leave the exchange. Limit orders instead of market orders remove much of the second cost.
Custody is the decision that outlasts the trade. Tokens meant to be held for months belong in a wallet whose keys you control, and the devices for that are compared in the hardware wallet comparison. TAO uses its own network addresses, so confirm that a device supports the chain before buying one.
So is Bittensor a good buy at current prices?
For a horizon of a few weeks, the data argue for caution rather than urgency. The price stands 4.9 percent below the 200-day average of 239.76 US dollars, the RSI at 62.7 leaves limited room before the overbought zone, and the seven-day gain of 19.7 percent has already collected much of what a quick move had to offer. A pullback towards the 50-day average at 207.63 US dollars would be an ordinary event.
For a horizon of a year or more, the case looks different. An entry 54.2 percent below the twelve-month high, into an asset with a capped supply of 21 million tokens and a functioning use inside its own network, has a plausible risk profile provided the position is sized for a further decline to the 145.64 US dollar area. That is roughly 36 percent below today's price and it is the level the recovery started from.
Two conditions would falsify the constructive reading. A weekly close below 207.63 US dollars would put the 50-day support in question and turn the summer advance into a failed rally. A drop under 145.64 US dollars would mark a new twelve-month low and end the recovery case entirely. Conversely, a weekly close above 239.76 US dollars would be the first technical evidence that the twelve-month downtrend has ended, and it is the single number worth watching.
Buying Bittensor: what to take away
- The 200-day average at 239.76 US dollars decides the trend question. Above it the downtrend is over, below it the move from 145.64 US dollars remains a counter-trend rally. The possible price bands from here are set out in the Bittensor price prediction.
- Momentum argues for staggering rather than a single purchase. An RSI of 62.7 and a 19.7 percent weekly gain are poor conditions for committing a full position at once, and fee differences compound across several tranches. The exchange comparison shows where staggered buying costs least.
- Settle custody before the purchase, not after it. Anything intended to be held beyond a few weeks does not belong on an exchange account permanently. Suitable devices are listed in the hardware wallet comparison.
Disclosure: Some of the providers mentioned in this article work with us through partner programmes. This has no influence on the price analysis or on the assessment of the chart situation; the price data comes from a public market data source and can be verified there.
(As of 25 August 2026. This article is not investment advice. Prices, fees and conditions change; check them with the provider before every purchase. Crypto assets are subject to large price swings, and a total loss is possible.)