Cronos (CRO) changes hands at 0.0606 US dollars on 24 August 2026. That price sits roughly 81.5 percent below the twelve-month high of 0.3284 dollars set on 29 August 2025, and about 31.1 per
Cronos (CRO) changes hands at 0.0606 US dollars on 24 August 2026. That price sits roughly 81.5 percent below the twelve-month high of 0.3284 dollars set on 29 August 2025, and about 31.1 percent above the twelve-month low of 0.0462 dollars printed on 19 August 2026. A gain of 27.7 percent over seven days has lifted the token off that floor faster than most assets of comparable size. The question here is narrower than the headline move suggests: is Cronos a good buy at the current price?
cryptoticker.io collected the underlying price data itself on 24 August 2026. Source: market data from CoinMarketCap. Method: 365 daily closing prices from 24 August 2025 to 23 August 2026 plus the current spot quote, with exponential moving averages and the relative strength index derived from those closes using the standard formulas. Every figure below refers to that snapshot and will move with the market. A longer-dated view sits in our Cronos price prediction.
Cronos price analysis: where the CRO price stands and which levels matter
Three levels frame the current picture. The floor is the twelve-month low at 0.0462 dollars, five days old at the time of writing and therefore the most recent point at which sellers ran out of conviction. The current zone around 0.0606 dollars sits about 12 percent above the 50-day exponential moving average of 0.0541 dollars, which the price reclaimed during the rally rather than merely touching. Overhead lies the 200-day exponential moving average at 0.0741 dollars, roughly 18 percent above the spot price and untouched since the spring.
The distance between the averages tells its own story. With the 50-day line at 0.0541 dollars and the 200-day line at 0.0741 dollars, the shorter average remains well below the longer one, a configuration conventionally read as a market still inside a downtrend however sharp the recent bounce. The rally changed the token's position relative to the short average, not to the long one.
The twelve-month range puts the move in proportion. From 0.3284 dollars down to 0.0462 dollars is a drawdown of about 86 percent, and the recovery to 0.0606 dollars retraces only a small fraction of it. Cronos is down about 61.7 percent over 365 days and 11.3 percent over 90 days, while gaining 7.3 percent over 30 days.
Is the Cronos downtrend broken or only interrupted?
A downtrend is usually treated as broken when price closes above the long-term average and the sequence of lower highs ends. Neither condition is met. At 0.0606 dollars, CRO trades below the 200-day line at 0.0741 dollars, and the last significant swing high in the summer still stands above the current level. What the move has achieved is a reclaim of the 50-day average at 0.0541 dollars, which is the first of the two conditions and the easier of them.
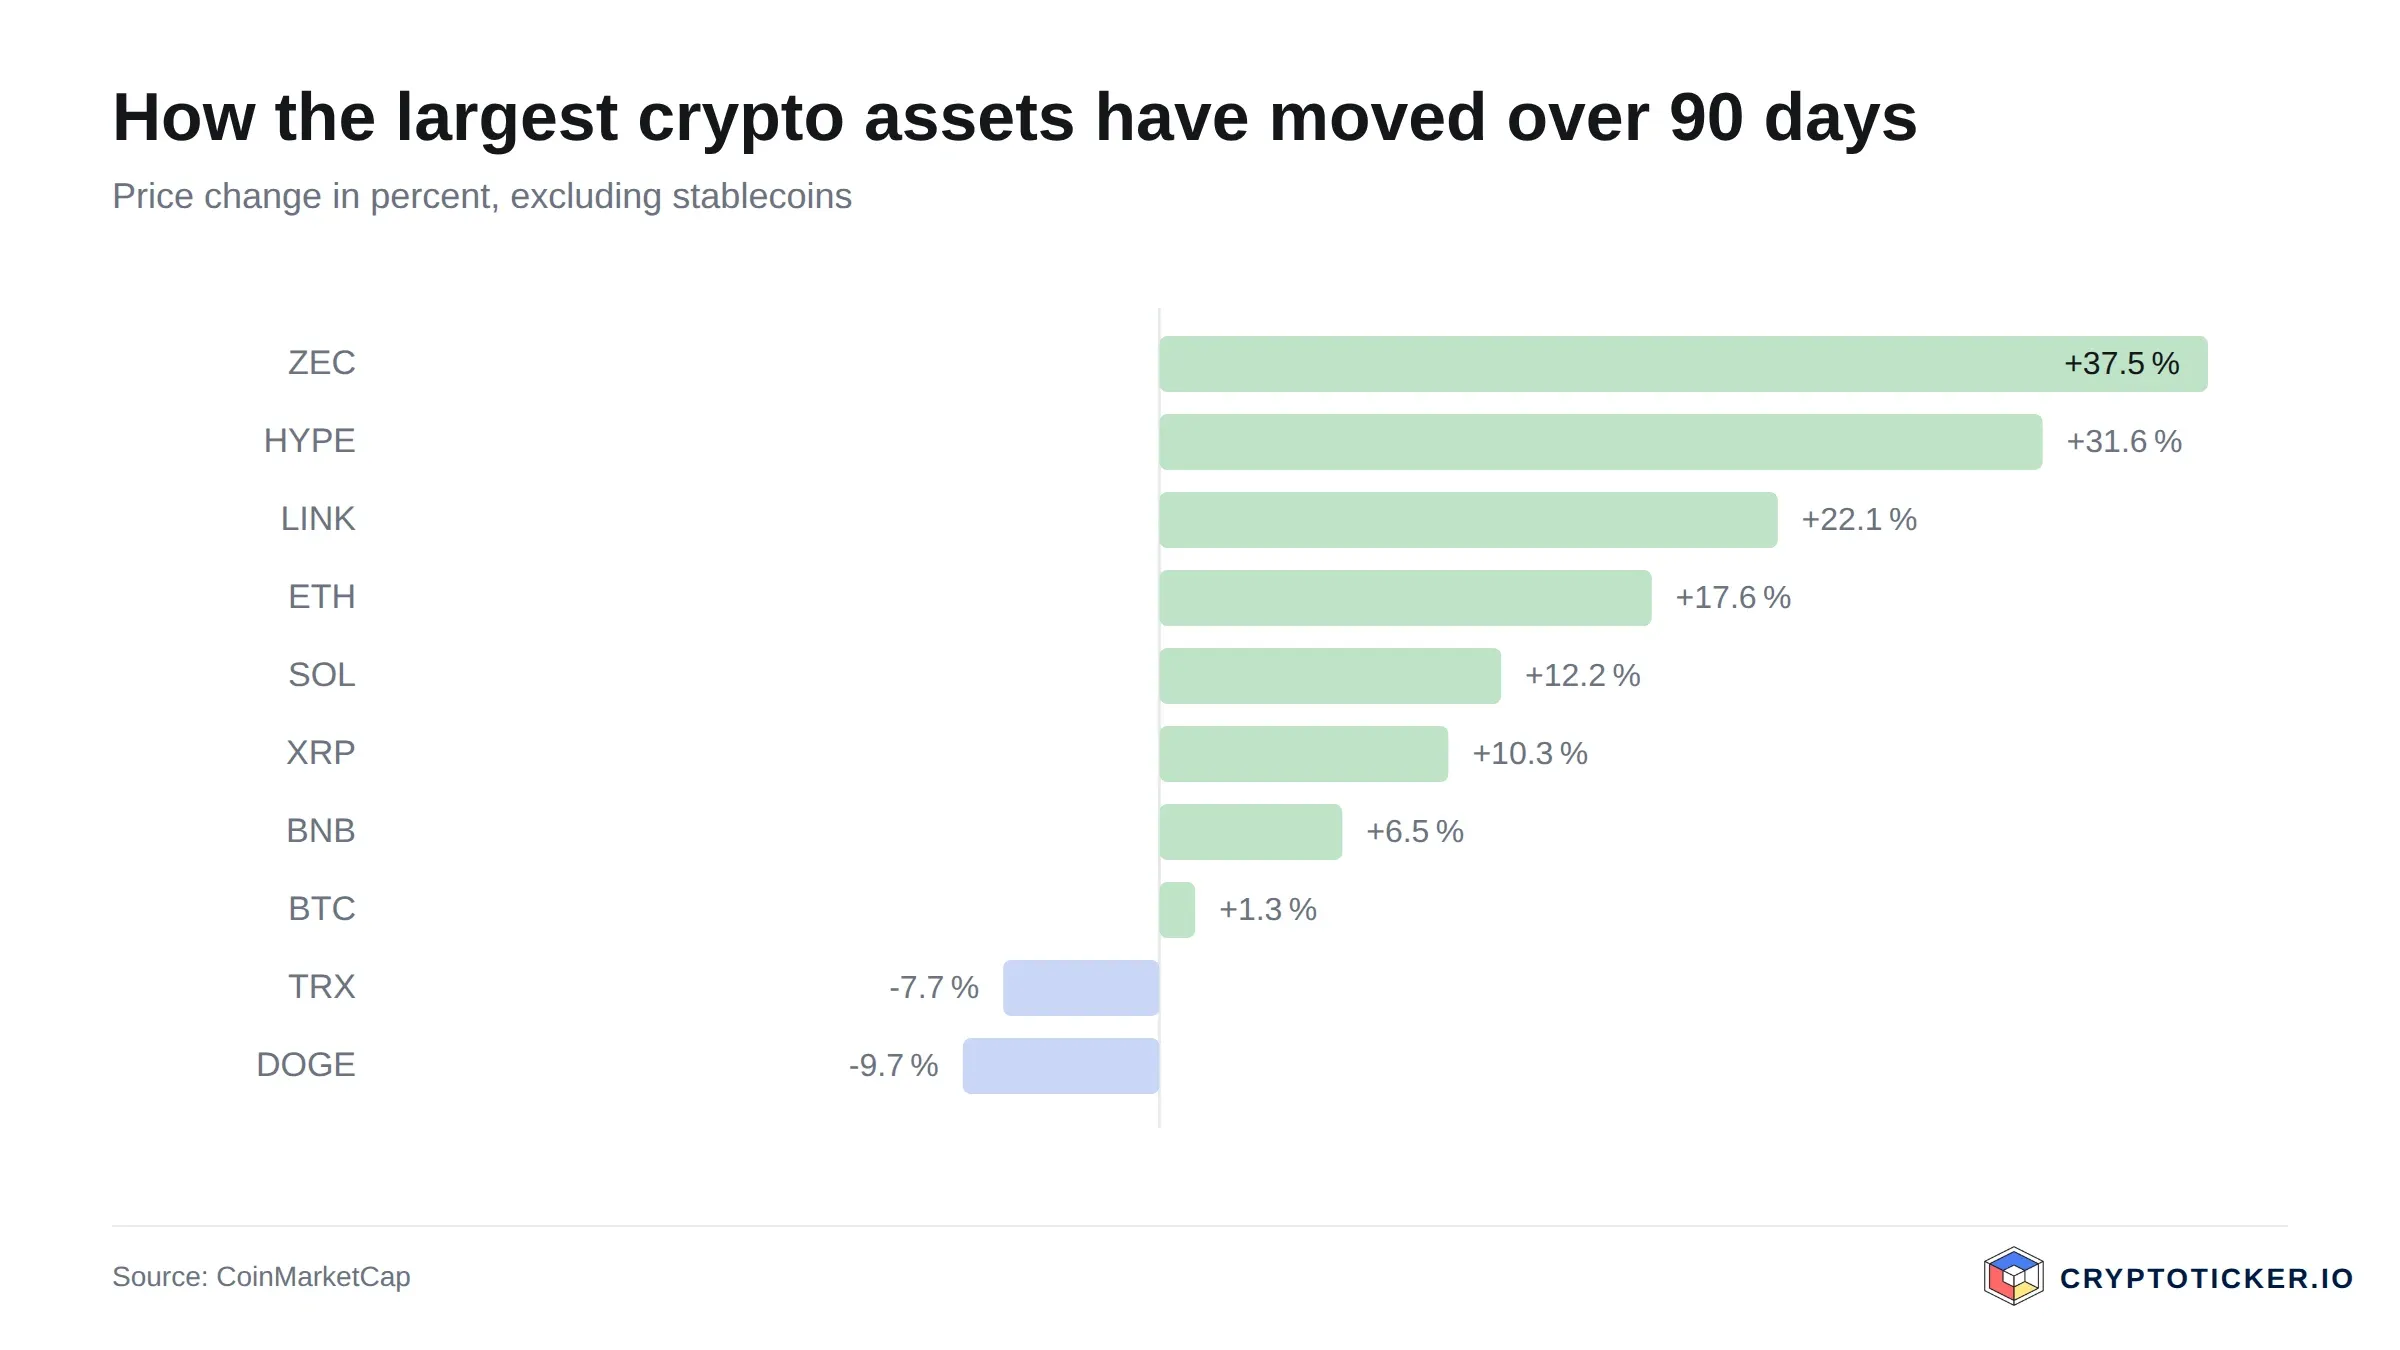
The largest crypto assets compared over 90 days, according to CoinMarketCap data
That distinction matters for anyone sizing an entry. An interruption can last weeks and still resolve downward; a break requires measurable follow-through, here a close above 0.0741 dollars that holds. Until then the prudent description is a strong countertrend rally inside an intact downtrend.
A second reading is worth stating as an inference rather than an observation: much of the seven-day move arrived alongside a broad risk-on phase, with the CoinMarketCap Fear and Greed reading at 78, in greed territory. Rallies that ride sentiment rather than token-specific news tend to give back ground when sentiment normalises. That is a plausible explanation, not a proven cause.
What RSI and moving averages mean for a Cronos entry
The 14-day relative strength index stands at 71.4. Above 70 the indicator is conventionally described as overbought, which is less a sell signal than a statement about pace: the token has risen far enough, fast enough, that the average up-day has dominated the average down-day by an unusual margin. In strong trends RSI can stay above 70 for extended stretches. In countertrend bounces it more often marks the upper half of the move.
Combined with the moving averages, the picture is a token that has run hard into the lower edge of its resistance band. Entry at 0.0606 dollars means buying about 12 percent above the 50-day average at 0.0541 dollars and about 18 percent below the 200-day average at 0.0741 dollars. That asymmetry is uncomfortable for a short-term trade: the nearest support is the reclaimed 50-day line, and beneath it the twelve-month low at 0.0462 dollars, roughly 24 percent below spot.
For a longer horizon the indicator readings carry less weight than the range itself. A buyer at 0.0606 dollars pays less than a fifth of the 0.3284 dollar high and roughly a third more than the 0.0462 dollar low. Whether that is cheap depends on what the network is worth, which the chart cannot answer.
What Cronos trading volume reveals about demand
Reported 24-hour turnover is about 10.7 million dollars against a market capitalisation of roughly 2.94 billion dollars, which places CRO at rank 29 by size. That ratio, near 0.36 percent, is thin for a token of that capitalisation, and it is the single most important qualifier on everything above.
Thin turnover has two consequences. A rally on low volume moves price further per dollar of buying, which flatters the percentage gain. And an exit in size is harder to execute at the quoted price, because the book that produced the move up is the same one that has to absorb selling. Anyone reading the 27.7 percent weekly gain as broad accumulation should weigh how little capital was required to produce it.
Which structural factors speak for Cronos
Three structural features distinguish CRO from a pure momentum token. The first is supply mechanics. Circulating supply stands at about 48.51 billion tokens against a total of roughly 98.88 billion and a stated maximum of 100 billion. The float that trades today is therefore a minority of the tokens that could eventually trade. That is a fact about the supply schedule rather than a prediction, and its effect on price depends on release pace and on demand at the time of release.
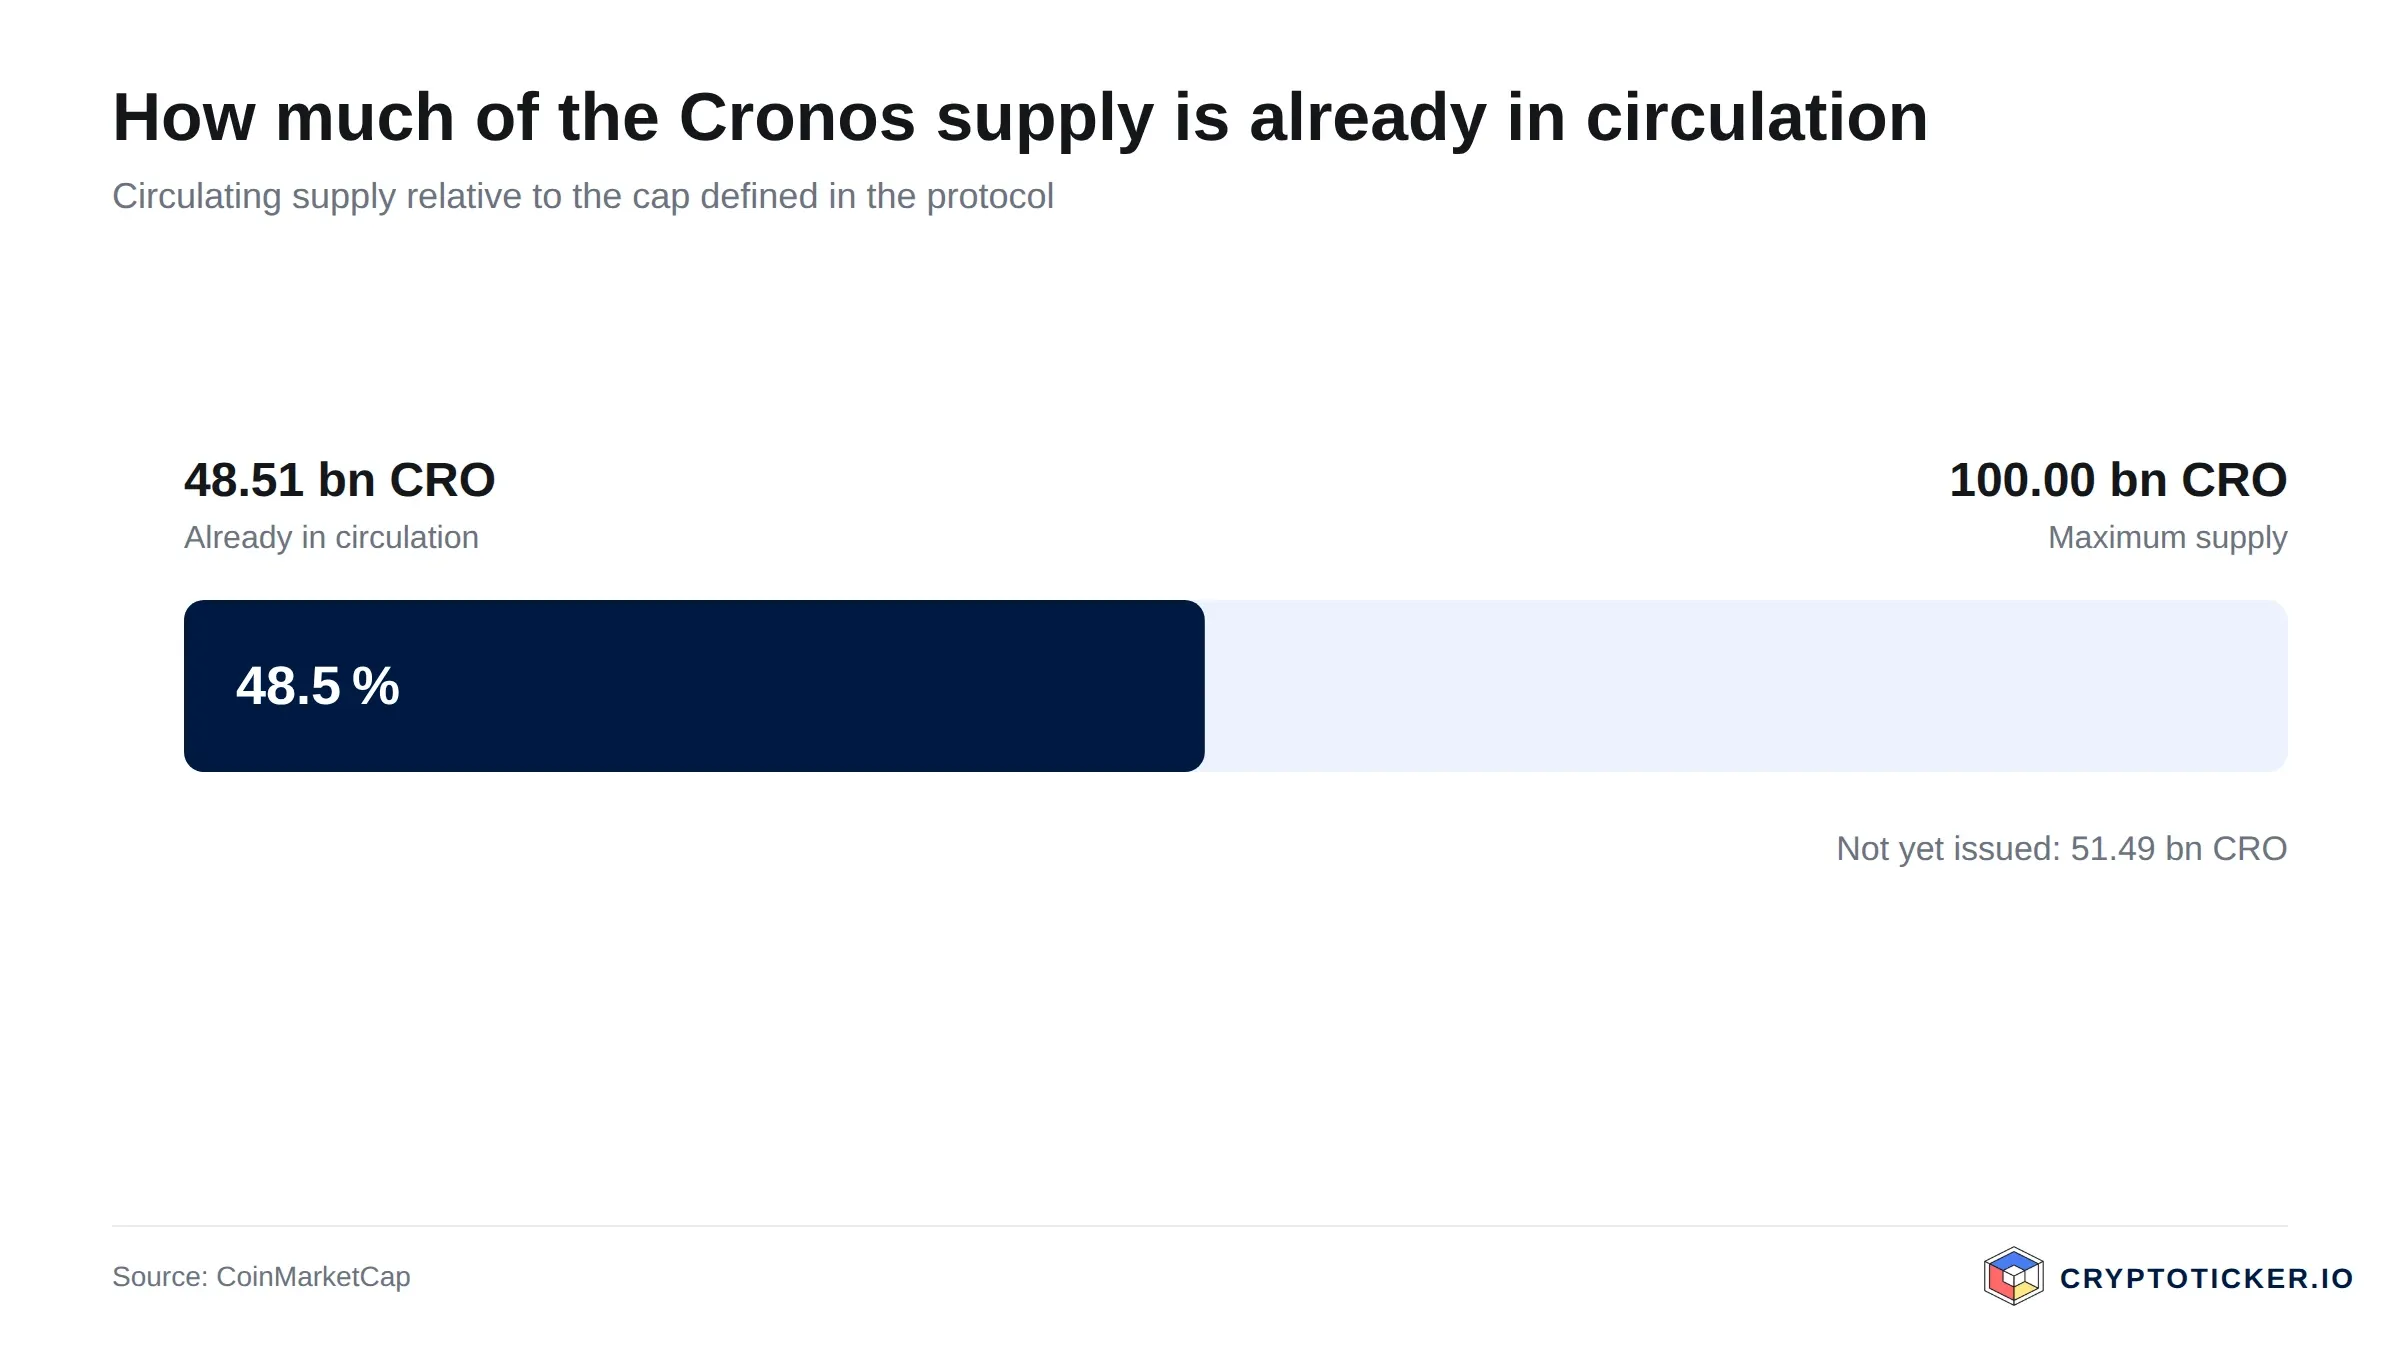
Cronos supply structure according to CoinMarketCap data
The second is the chain's technical position. Cronos runs an Ethereum-compatible execution environment, so contracts and tooling written for Ethereum deploy with limited modification. The upside is a developer base the network did not have to build; the downside is direct competition with every other chain making the same offer, on fees and liquidity rather than capability. The ecosystem it borrows from is documented on the Ethereum roadmap.
The third is regulatory placement. CRO is closely associated with a large regulated exchange business operating inside the European framework for crypto-asset markets published by ESMA. That cuts both ways: it lowers the risk of an abrupt delisting across regulated venues, and it ties the token's fortunes to a single commercial entity's performance.
What speaks for buying Cronos at current prices
- The entry sits far below the twelve-month range high. At 0.0606 dollars, buyers pay about 81.5 percent less than at the 0.3284 dollar high of August 2025. For an investor who believes the network retains value, a price this deep in its own range is a materially better starting point than any level over the past year.
- The short-term trend has turned. Reclaiming the 50-day average at 0.0541 dollars and holding above it is the first technical condition a recovery has to satisfy. It has been met, and it gives a clearly defined level beneath the current price against which a position can be measured.
- The exchange linkage provides a revenue-bearing anchor. Unlike tokens whose value rests solely on future network usage, CRO is tied to an operating business with fee income and a regulated footprint. That does not guarantee a price floor, but it means the token's fundamental case can be assessed against something observable.
What speaks against buying Cronos at current prices
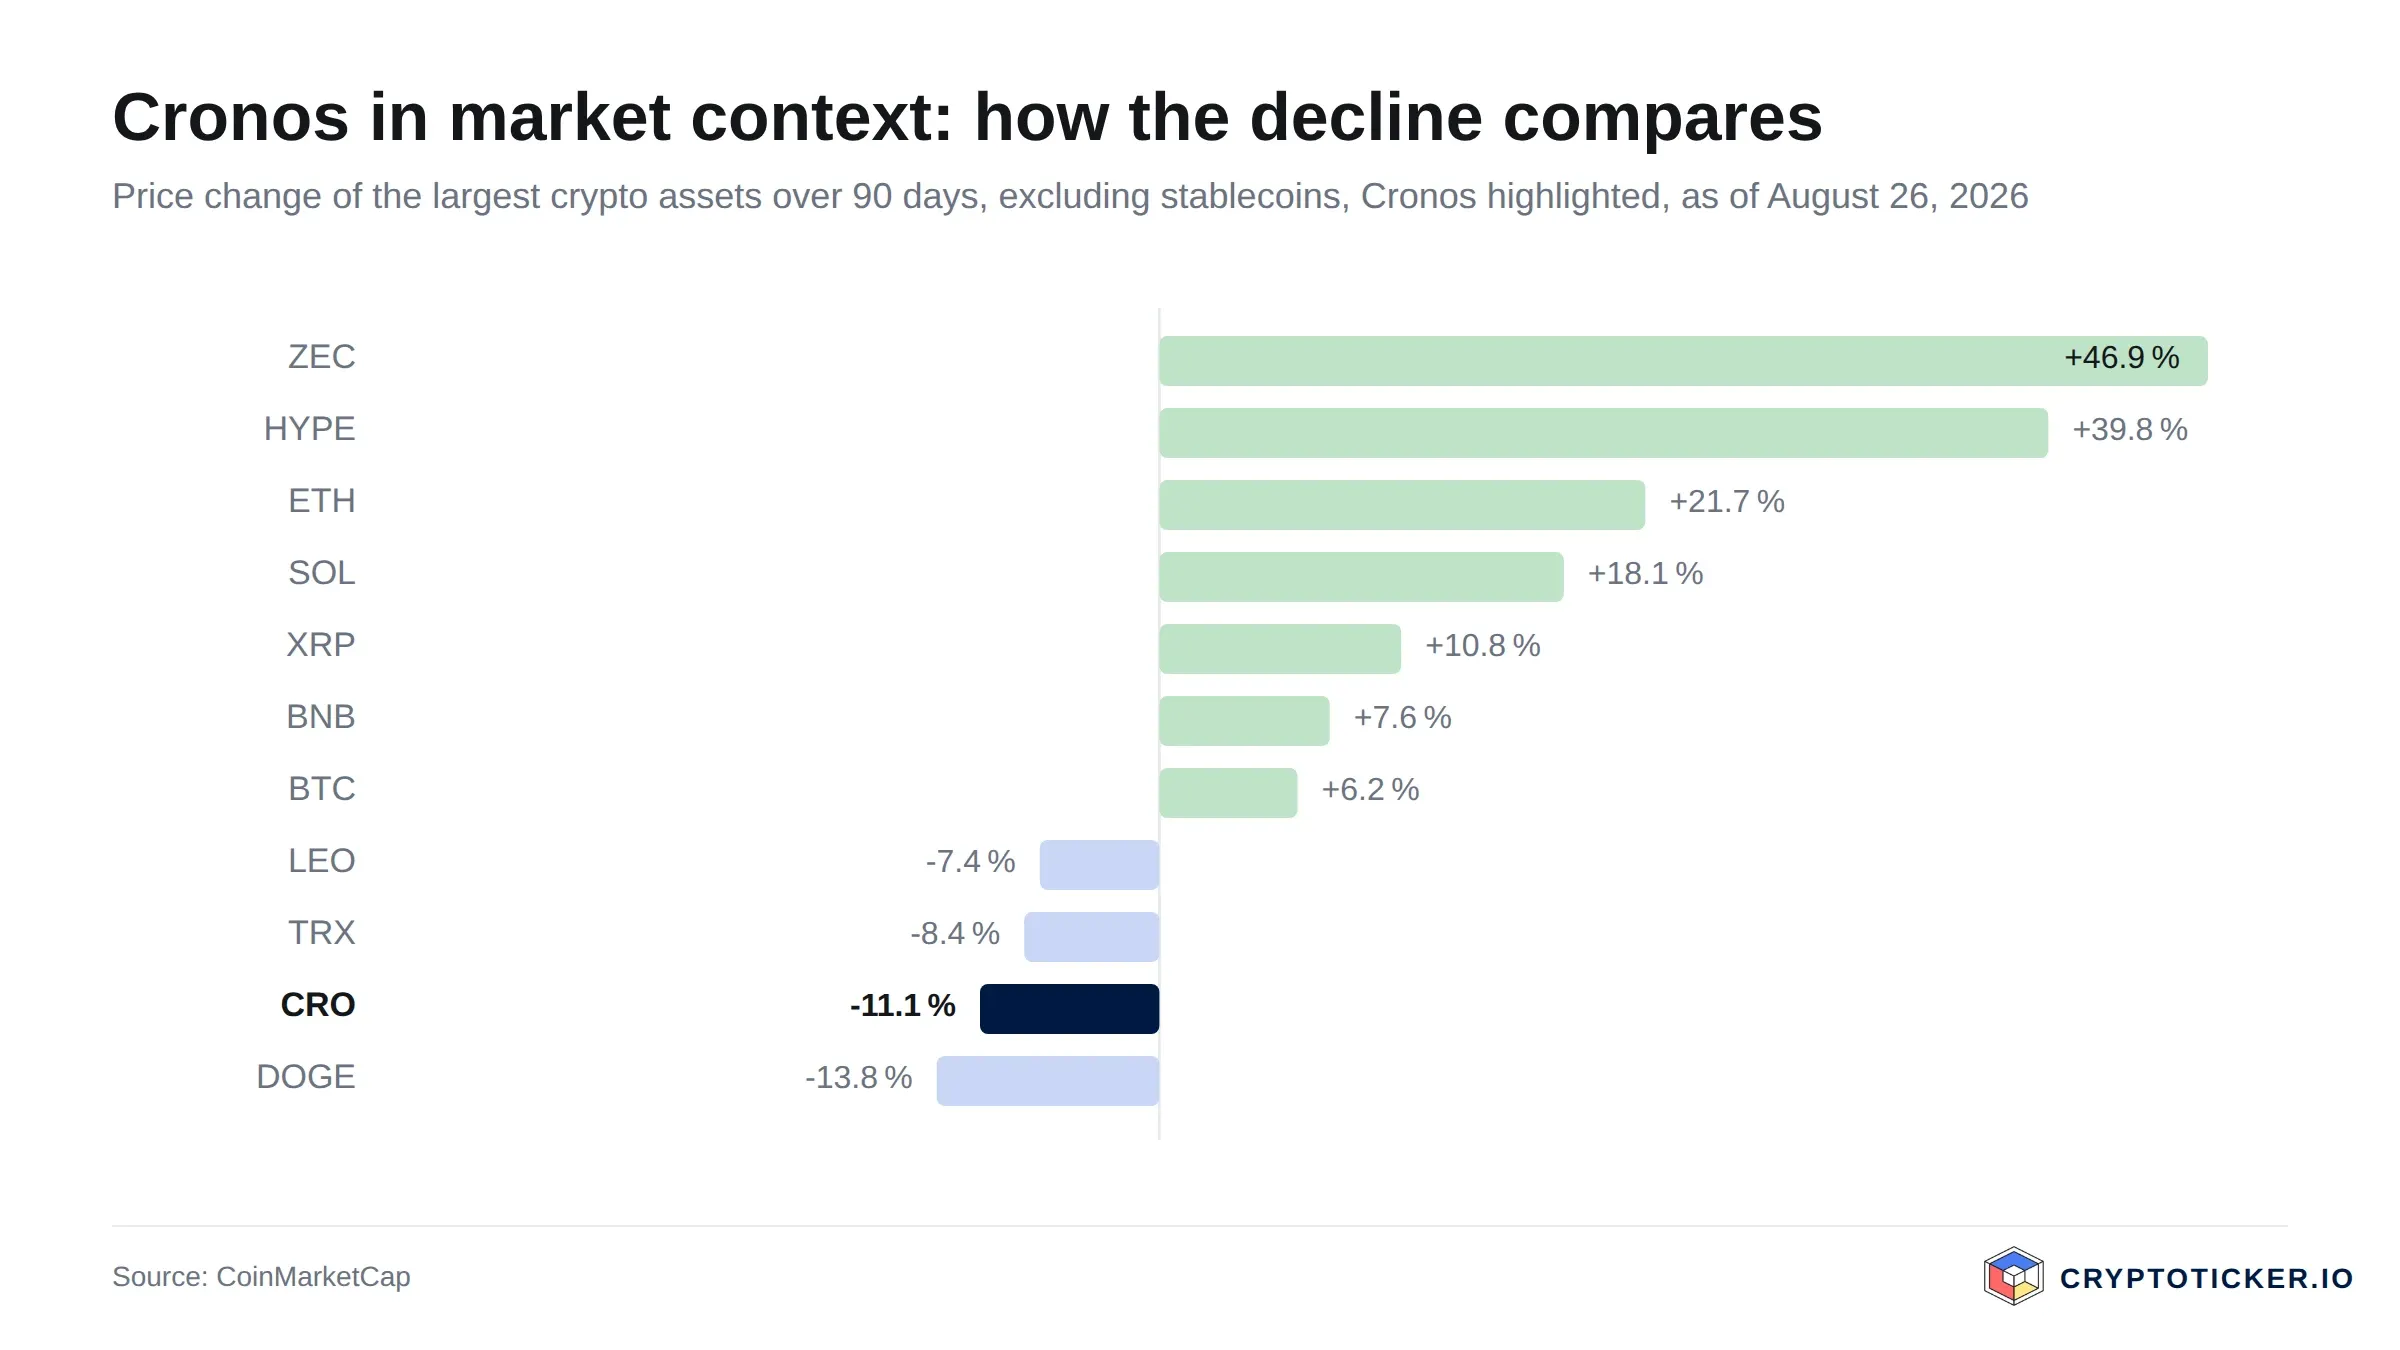
Cronos compared with the other large crypto assets over 90 days
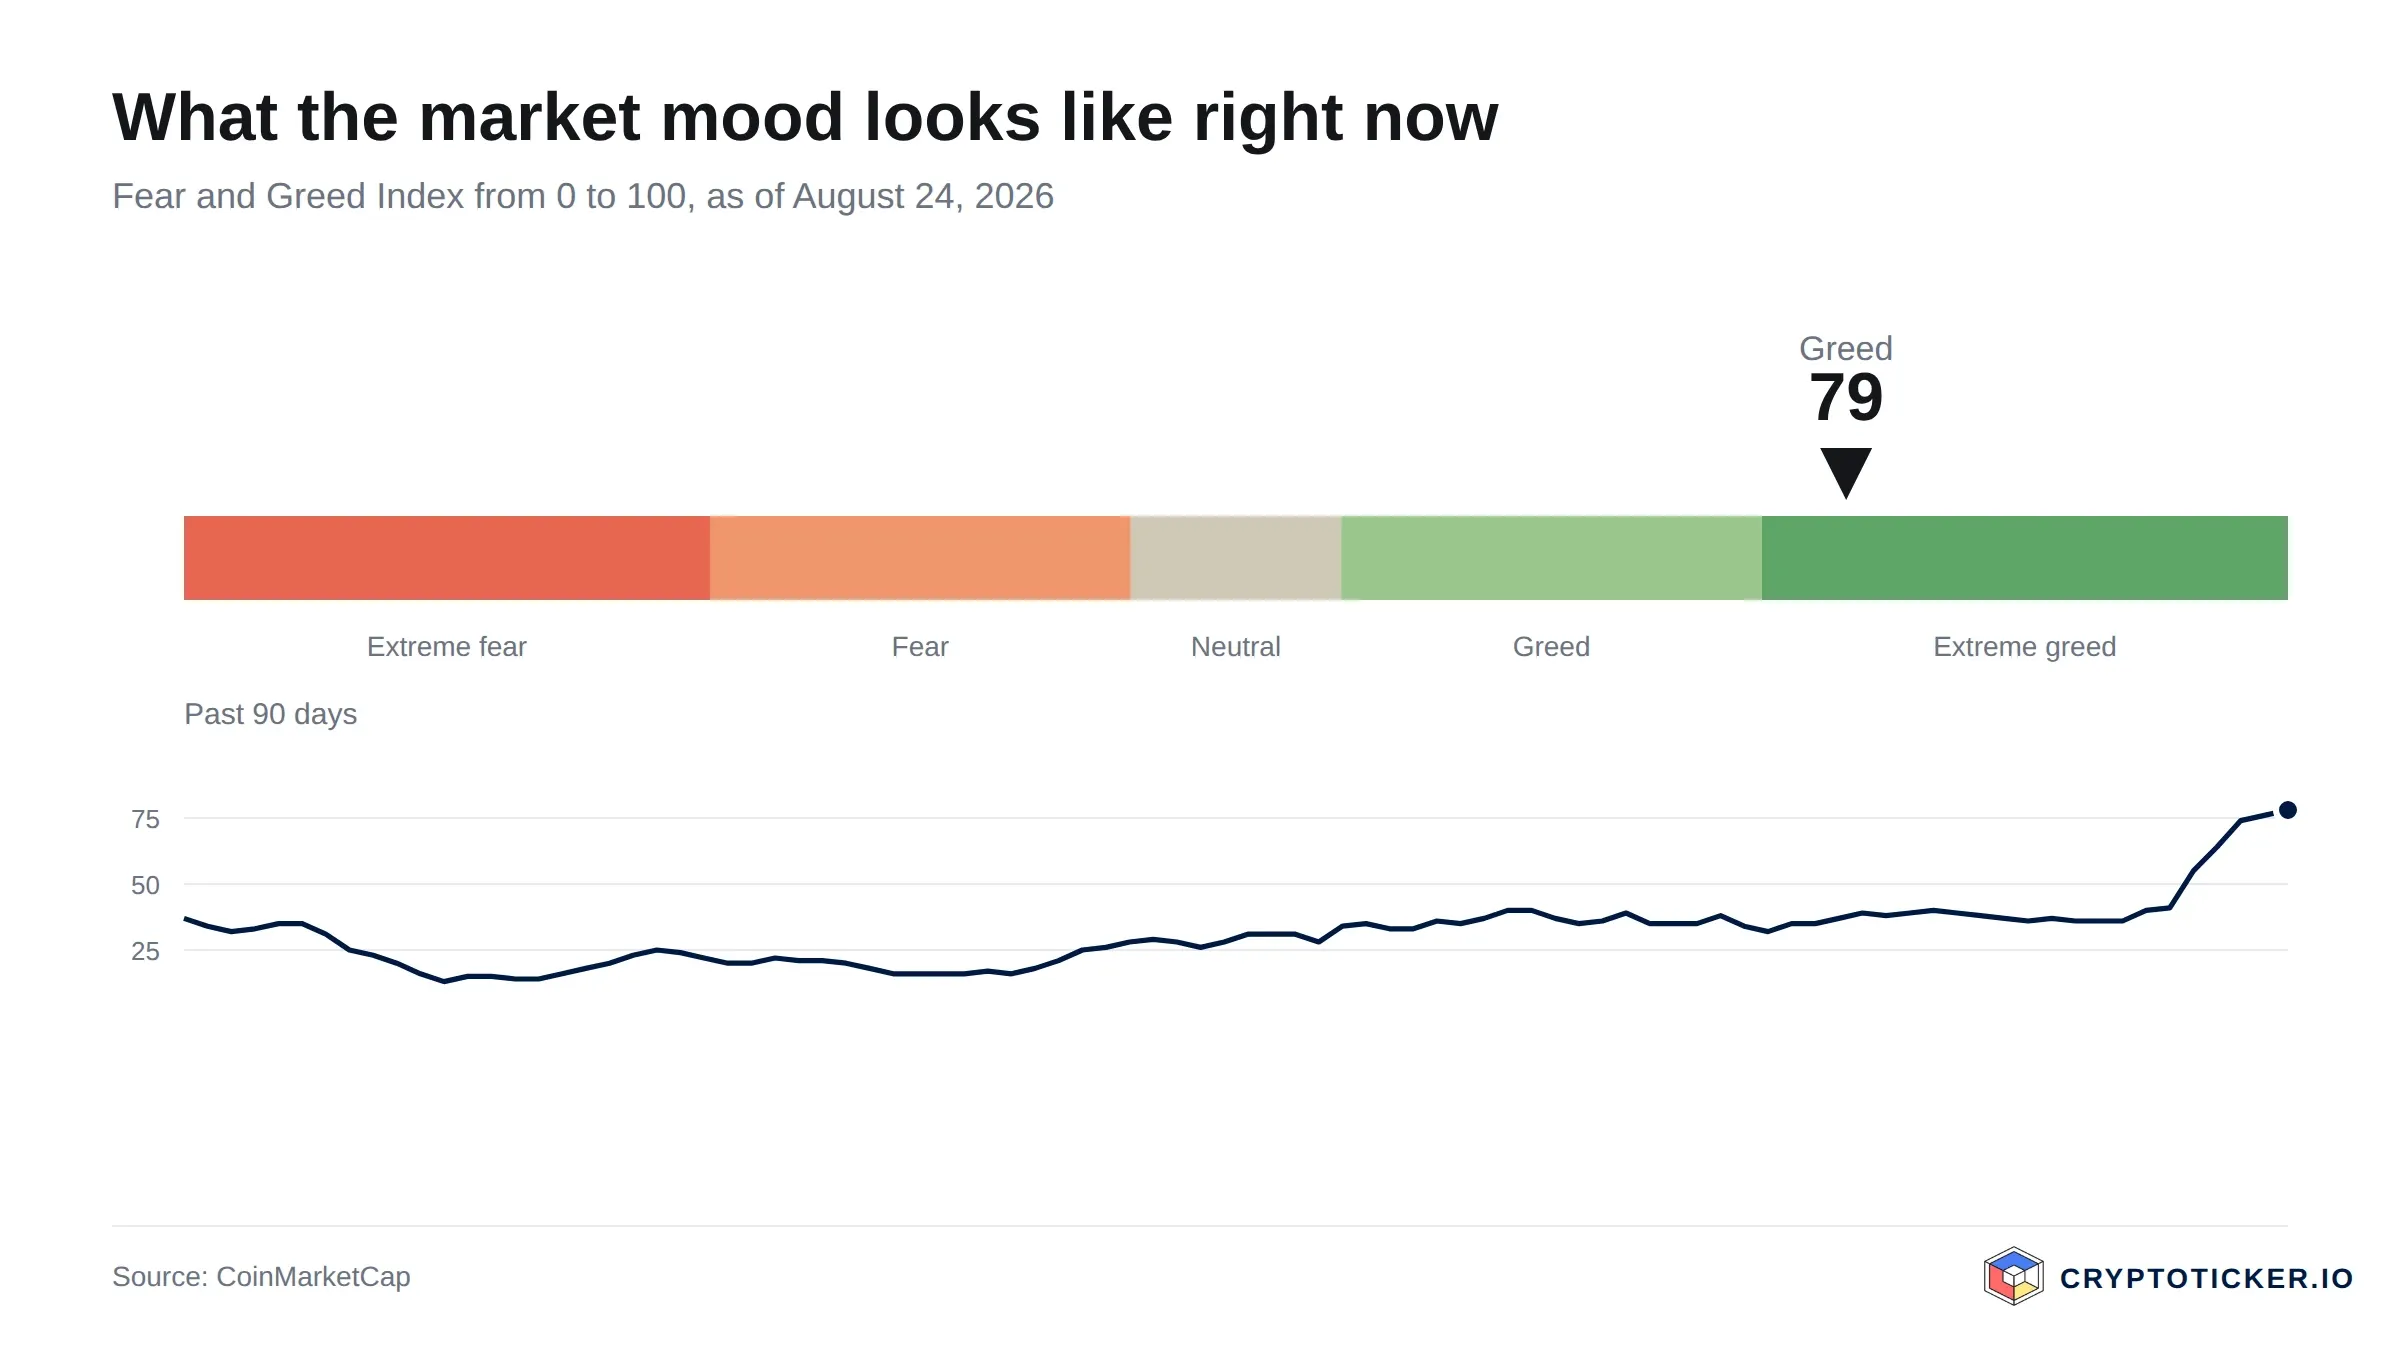
The Fear and Greed Index places market sentiment between extreme fear and extreme greed
- The long-term downtrend is intact. With price at 0.0606 dollars and the 200-day average at 0.0741 dollars, the dominant trend still points down. Buying here means buying into resistance, and the 24 percent gap down to the 0.0462 dollar low defines how far a failed bounce can travel.
- Liquidity is thin for the size. Roughly 10.7 million dollars of daily turnover against a 2.94 billion dollar capitalisation makes both the upside move and any future exit less reliable than the headline market rank suggests.
- Half the maximum supply has yet to enter circulation. About 48.51 billion of a possible 100 billion tokens trade today. Any future increase in the circulating float is a headwind that demand has to absorb before price can advance.
How to buy Cronos at the current price
CRO is listed on most large regulated European venues, so the practical differences are fees, spread and custody rather than availability. Spot fees typically fall between 0.1 and 0.5 percent per trade, and the spread on a thinly traded token often costs more than the stated commission. Our exchange comparison sets the current terms side by side, and the shortlist of regulated exchanges narrows it to venues under European supervision. Two of them are covered in our Kraken review and our Bitvavo review.
Custody is the second decision. Leaving tokens on the exchange is convenient and carries that venue's operational risk; self-custody removes it and transfers key management to the holder. For positions held through a full cycle a hardware wallet is the standard answer, and the devices are compared in our hardware wallet comparison. Note that CRO exists on more than one network, and sending it to an address on the wrong one is the most common way holders lose tokens permanently.
Given the liquidity profile described above, a position built in a single market order will pay a wider spread than the same position built in parts. Fees, spreads and terms change; check them at the provider before every purchase.
Is Cronos a good buy at current prices, short term and long term?
Short term, the evidence points to caution rather than opportunity. At 0.0606 dollars the token has already travelled 31.1 percent from its low, the RSI at 71.4 indicates the move is stretched, and the 200-day average at 0.0741 dollars stands as the next obstacle. A short-term buyer is paying up for a move that has largely happened, into resistance, in a thin book. The scenario that would change this reading is a daily close above 0.0741 dollars that holds for several sessions on rising turnover.
Long term, the assessment turns on the exchange linkage and the supply schedule rather than the chart. At a capitalisation near 2.94 billion dollars the token is priced far below its 2025 valuation, and an investor expecting the associated business to grow inside the European framework buys that expectation at a steep discount to last year's price. That case would be refuted by a sustained fall below the 0.0462 dollar low, by circulating supply expanding materially faster than demand, or by a durable decline in the exchange business the token is tied to.
Neither reading amounts to a recommendation. The short-term technical setup and the long-term structural case currently point in different directions, and which one matters depends on the holding period the buyer actually intends.
Buying Cronos: what to take away
- At 0.0606 dollars CRO trades above its 50-day average of 0.0541 dollars and below its 200-day average of 0.0741 dollars, which describes a recovery inside an intact downtrend. The level that would change that description is 0.0741 dollars, and the longer-dated view is set out in our Cronos price prediction.
- Roughly 10.7 million dollars of daily turnover against a 2.94 billion dollar capitalisation is thin, which affects both entry and exit. Where you trade therefore matters more than usual, and the current terms are compared in our exchange comparison.
- With about 48.51 billion of a possible 100 billion tokens in circulation, supply expansion is a standing headwind for any multi-year position. Holdings intended for that horizon belong in self-custody, and the devices are compared in our hardware wallet comparison.
Disclosure: Some of the providers mentioned in this article work with us through partner programmes. This has no influence on the price analysis or on the assessment of the chart situation; the price data comes from a public market data source and can be verified there.
(As of 24 August 2026. This article is not investment advice. Prices, fees and terms change; check them with the provider before every purchase. Crypto assets are subject to high price volatility and a total loss is possible.)