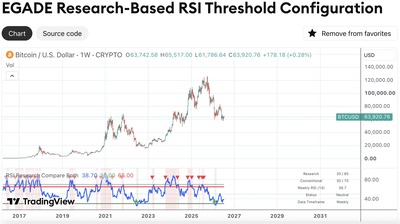
Conventional Relative Strength Index settings may not work equally well across assets, according to research comparing RSI thresholds in nine cryptocurrencies and the S&P 500. RSI is a moment
Conventional Relative Strength Index settings may not work equally well across assets, according to research comparing RSI thresholds in nine cryptocurrencies and the S&P 500.
RSI is a momentum indicator ranging from 0 to 100. Readings at or below 30 suggest potentially oversold conditions, while readings at or above 70 suggest an asset may be overbought. The study asks whether alternatives produce better historical signal outcomes.
Hatem Mabrouk, Federico Trigos and Francisco Valderrey, professors at EGADE Business School, Tecnológico de Monterrey, Mexico, conducted the study, titled “RSI Threshold Configurations and Signal Behaviour in Cryptocurrency and Traditional Markets: An Empirical Analysis on Weekly Data.” The paper was presented at the 33rd International Conference on Transdisciplinary Engineering (TE2026) in Tainan, Taiwan, and is scheduled for publication in the conference proceedings in October 2026.
The study examined weekly RSI data covering the full available history of each cryptocurrency from its inception through January 8, 2025. For the S&P 500, the data covered March 1957, when the index launched in its current form, through February 23, 2026.
The researchers compared nine combinations of buy thresholds—25, 30 and 35—and sell thresholds—65, 70 and 75. For example, 30/65 means an entry signal occurs when RSI is at or below 30, followed by an exit when RSI reaches or exceeds 65.
Each weekly entry signal was matched with the next exit signal. Settings were ranked by how often they produced a positive return. If settings scored equally, the researchers compared their geometric average weekly returns. If those also matched, they favored a shorter average wait between entry and exit.
The best-performing settings differed across the assets examined. Bitcoin favored 30/65, Ethereum 35/65, and Solana 30/75. TRON and XRP favored 35/70, Binance Coin and Dogecoin favored 35/75, and the S&P 500 favored 25/70.
The conventional 30/70 setting was among the best-performing choices for only two of the nine cryptocurrencies examined: Cardano and Avalanche. For Cardano, it matched 30/75 on all three comparison measures. For Avalanche, it matched 30/65.
Every setting selected as best for its asset produced positive returns across the historical signal pairs analyzed. However, some settings generated very few observations. Consecutive oversold weeks could share the same exit, so these were overlapping observations rather than independent trades or portfolio performance.
Cryptocurrency signals generally showed higher percentages of positive outcomes and larger weekly returns than the S&P 500, but a longer wait between entry and exit. Different historical windows warrant caution.
Readers can explore the EGADE Research-Based RSI Threshold Configuration indicator on TradingView. The research suggests questioning default settings, but does not recommend simply switching to different ones. Its analysis excludes transaction costs, slippage, and execution constraints and does not establish future performance.
Disclaimer: This article and the research it discusses are provided for informational and educational purposes only. They do not constitute financial or investment advice or a recommendation to buy or sell any asset. Historical results do not guarantee future performance. Investing involves risk, including the possible loss of capital.