Lorenzo Protocol just handed traders a brutal reminder of how fast BTCFi tokens can turn. BANK is down over 50% in a single session after a parabolic run to an all-time high near $0.55, and t
Lorenzo Protocol just handed traders a brutal reminder of how fast BTCFi tokens can turn.
BANK is down over 50% in a single session after a parabolic run to an all-time high near $0.55, and timelines are split between "healthy reset" and "bull trap."
The project builds a Bitcoin liquid staking and asset management layer, letting BTC holders earn yield through tokenized products called on-chain traded funds.
This Lorenzo Protocol Price Prediction looks at whether BANK can reclaim $0.21870 within the next few sessions, with a break below $0.10290 marking the point where the recovery case falls apart. Here's what the data shows.
BANK Market Overview
Metric
Value
Price
$0.15208
24h Change
−54.86%
Market Cap
$112.88M (−54.98%)
Unlocked Market Cap
$112.65M
24h Volume
$453.48M
Vol/Mkt Cap (24h)
426.66%
FDV
$309.08M
Liq/Mkt Cap
0.11%
Total Supply
1.21B BANK
Max Supply
2.1B BANK
Circulating Supply
764.94M BANK
Holders
58.93K
Source: Data from CoinMarketCap as of 29/07/2026. Figures may vary slightly across other tracking websites.
Indodax listing news:
Indonesian exchange Indodax announced via its official X account that BANK trading against the Indonesian Rupiah (BANK/IDR, BEP-20) begins on the platform on Thursday, July 30, 2026, at 14:00 WIB.
The announcement links to an educational explainer rather than any price target and carries a standard do-your-own-research disclaimer.
Source: Data From X
New exchange listings can add short-term liquidity and visibility, but Indodax itself has not made any claim about how this affects BANK's price trajectory.
Holder Concentration: Why This Matters for BANK
BANK's holder base is unusually concentrated for a token with nearly 59,000 wallet addresses. 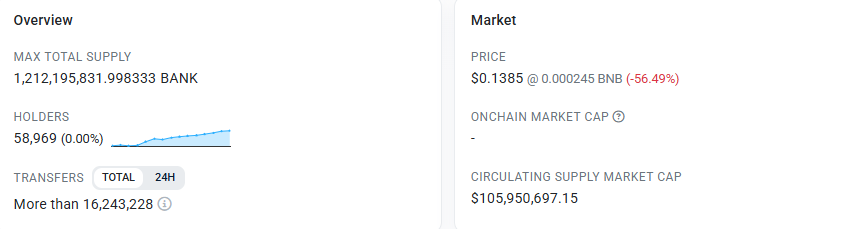
According to on-chain holder analytics, whale wallets account for just 0.07% of holders but control 96.49% of the circulating supply, and the top 100 addresses alone hold 99.48% of the total supply.
The Gini distribution score sits at 0.9996, with only 10 wallets each owning at least 1% of the total supply. 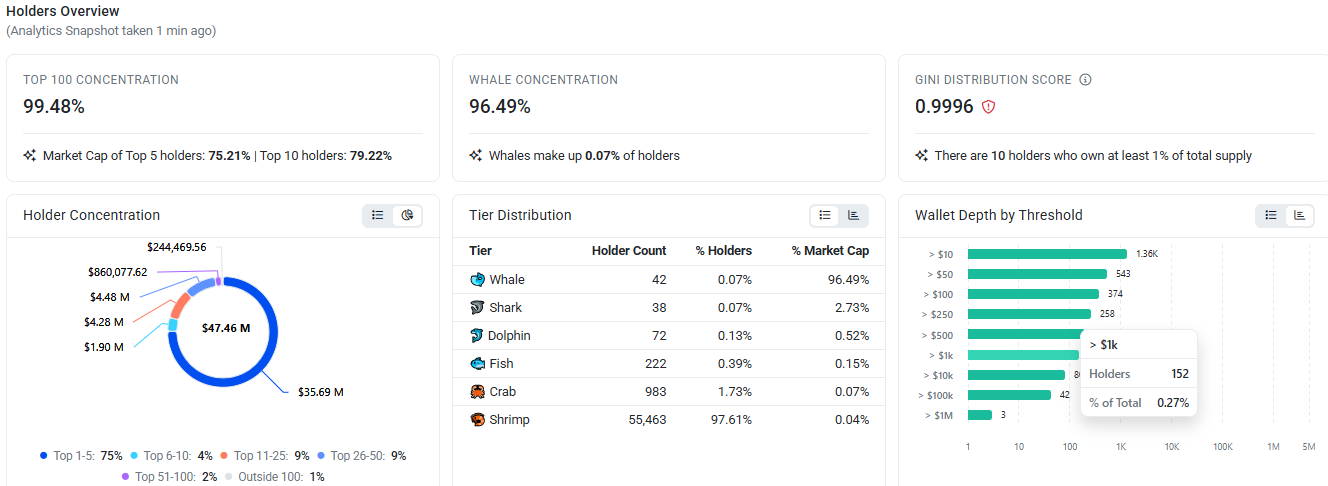
This level of concentration means a small number of large holders can move price sharply, which lines up directly with the depth of today's drop.
On the broader token metrics, max total supply is 1,212,195,831 BANK, with 16.24 million total transfers recorded on-chain to date.
Why Is BANK Price Falling So Sharply?
This looks like a parabolic-rally unwind rather than a project-specific negative event.
On 25th July 2026, as per TradingView's daily chart, BANK's rally into overbought RSI territory, i.e., 84, even while the price was still climbing, warned of reversal risk, a signal that appears to have played out.
The token had gained over 1,000% from its July lows before topping out near its all-time high around July 27, per CoinMarketCap data, and moves of that size typically invite sharp profit-taking.
That effect is likely amplified here by the holder concentration described above: with 96.49% of supply held by whale wallets, a relatively small number of large sell orders can produce an outsized price impact.
A general news check turned up no reports of a hack, exploit, or confirmed negative catalyst tied to Lorenzo Protocol specifically, so this reads as a technical correction rather than a fundamentals-driven sell-off, though that could change if new information emerges.
Lorenzo Protocol Price Prediction: Chart Analysis
BANK trades at $0.15208, down 45% in 24 hr. Price broke down from a well-defined ascending channel after hitting a high near $0.4500, breaking through the EMA 20 ($0.28819) and EMA 50 ($0.27263), both of which are now well below spot price and acting as overhead resistance.
RSI (14) has fallen to 29.35, putting BANK in oversold territory, often an early signal that selling pressure is exhausting itself, though not a guarantee of an immediate bounce.
Zooming out, the token rallied from roughly $0.05 in mid-July to its recent high near $0.40, meaning even after this drop, BANK sits well above where it started the month.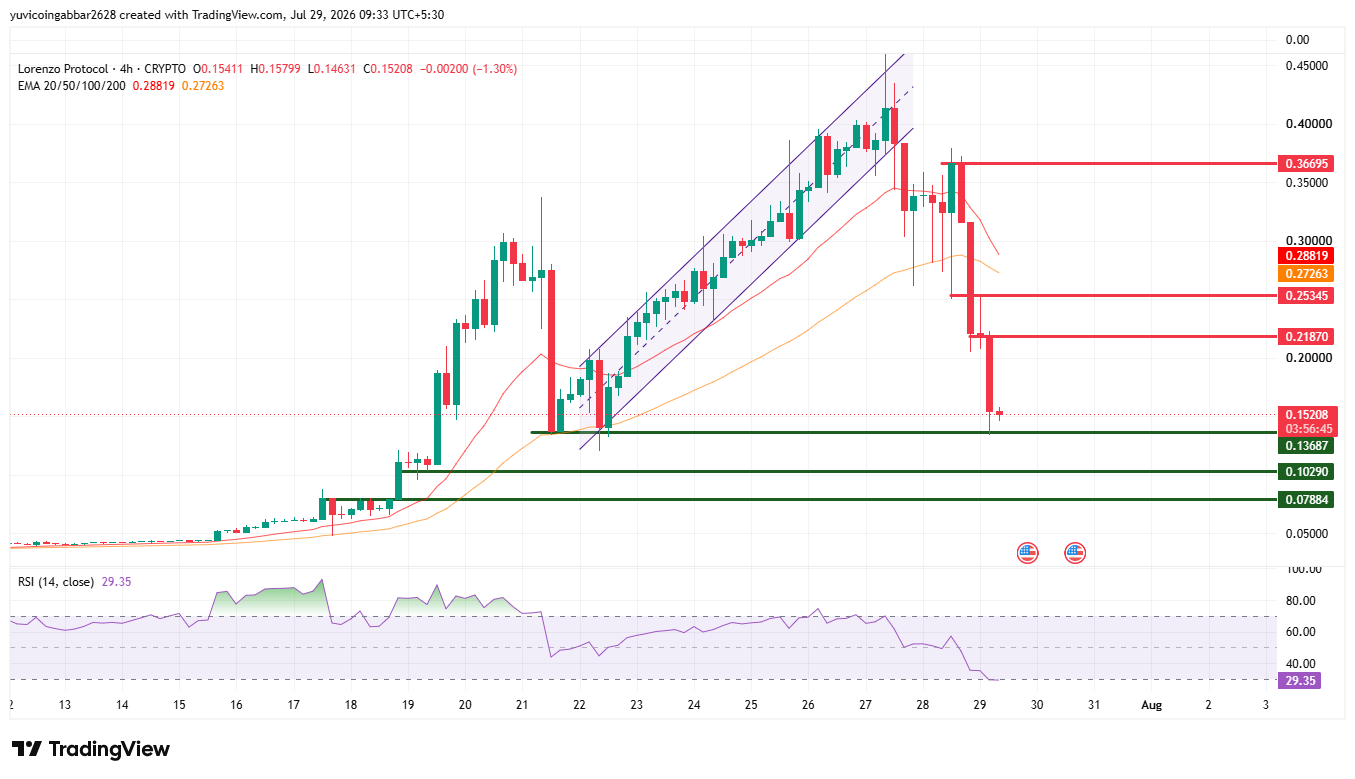
Level Type
Price
Label
Resistance 3
$0.36695
Prior supply zone
Resistance 2
$0.25345
Prior supply zone
Resistance 1
$0.21870
supply zone
Initial Recovery Level
$0.28819
EMA 20 reclaim
Immediate Price Reference
$0.15208
Current price
First Confirmed Support
$0.13687
Nearest support
Deeper Support
$0.10290
Lower support
Floor Support
$0.07884
Further downside floor
BANK Price Prediction: Recovery Rally or Bull Trap?
Scenario
Target
Trigger
Timeframe
Invalidation
Bullish
$0.36695
Reclaim of $0.21870 zone with rising volume
0–7 days
Close below $0.10290
Base
$0.13687–$0.17000 range
Price consolidates near current levels as selling pressure fades
0–7 days
Break below $0.10290 or above $0.21870
Bearish
$0.10290
Continued whale distribution and failure to hold $0.13687
0–7 days
Reclaim of $0.15208 with volume
The base case carries the highest weighting because oversold RSI plus a fresh support test typically produces sideways consolidation before a clear directional move, rather than an immediate breakout in either direction.
The bullish case is weighted below the base case since it requires a sustained reclaim of overhead EMAs against a backdrop of extreme whale concentration, while the bearish case reflects the real risk that concentrated holders continue distributing into any bounce.
Can BANK Reach $0.36695?
A move back to $0.36695—the higher of the two broken supply zones—is a longer shot than the base bullish scenario but not off the table if momentum builds.
It would require BANK to first reclaim $0.21870 and the EMA 20 initial recovery level at $0.28819 and then push through closer to $0.36695.
Given the Vol/Mkt Cap ratio of 426.66%, there's clearly enough trading activity in the market to fuel a fast move if buyers step back in.
The open question is whether whale wallets holding 96.49% of the supply choose to add to positions or continue selling into strength.
What Could Invalidate the Bullish Setup?
The bullish case breaks down if BANK closes below the $0.10290 deeper support level, which would suggest the oversold bounce failed and distribution is continuing.
A failure to reclaim $0.21870 within the next few sessions, or a fresh spike in sell volume without a corresponding price floor, would also weaken the recovery thesis.
Because whale concentration is this high, any large wallet movement visible via on-chain transfer data should be treated as an early warning sign regardless of what the chart pattern alone suggests.
Prediction Methodology
This forecast is built from multiple inputs rather than a single chart pattern: current market structure (price relative to EMA 20/50), the specific support and resistance levels visible on the 4H chart, spot trading volume relative to market cap, RSI momentum, and holder-concentration data from on-chain analytics.
Confirmed exchange listing news and unverified social-media claims were both factored in but weighted according to their source reliability.
No single data point above was used in isolation to generate the bullish, base, or bearish scenarios.
Expert View
According to CoinGabbar analysts, taken together, the chart, holder, and volume data point to a market that overextended fast and is now searching for a floor.
The oversold RSI reading is a genuine tailwind for a short-term bounce, but the extreme whale concentration means any relief rally is vulnerable to renewed selling from a small set of wallets.
A cleaner signal would come from watching whether BANK can hold $0.13687 on rising volume over the next few sessions; a fade back below that level on thin volume would suggest the bounce lacks real buyer conviction rather than confirming a genuine recovery.
Data Sources
Chart data: TradingView, BANK/USD spot, 4H timeframe, July 29, 2026, 09:33 UTC+5:30. Market cap, price, and volume: CoinGecko-style tracker snapshot, same date. Holder concentration and Gini score: on-chain analytics snapshot. Exchange listing news: Indodax official X account. No Coinglass futures/liquidation data were available for this analysis.
Disclaimer: This article is for informational purposes only and should not be treated as investment advice. Cryptocurrency markets are highly volatile, and readers should conduct their own research before making any financial decisions. CoinGabbar could not independently verify claims made on social media that are cited above, and third-party estimates should be treated as such unless otherwise noted.