Meme coin price prediction was clear weeks ago; four of the biggest coins are bleeding today, and the charts never lied. The meme coin party didn't end with a bang; it ended with weeks of sil
Meme coin price prediction was clear weeks ago; four of the biggest coins are bleeding today, and the charts never lied.
The meme coin party didn't end with a bang; it ended with weeks of silence, slow fades, and traders convincing themselves it was just a dip.
Bonk, Pepe, Shiba Inu, and Dogecoin all told the same story at the same time, which is never a good sign.
When four coins bleed together, it's not bad luck; it's a sector losing faith. And the uncomfortable truth is the charts saw this coming long before most wallets felt it.
Why Are Bonk, Pepe, Shib, and Doge All Falling Today?
Something's been building since late May, and most people didn't notice until it was too late. Bonk, Pepe, Shiba Inu, and Dogecoin have all been quietly losing ground week after week, with barely enough drama to make headlines.
That changed near June 4, when the slow bleed turned into a real breakdown. The entire meme coin sector moved together, which tells you this isn't about any one coin having a bad day.
It raises a simple but uncomfortable question: Is this a temporary dip or the start of something bigger?
What Are These Meme Coins and Why Do People Trade Them?
Bonk is a Solana-based meme coin that exploded in popularity in late 2022 and has built a small but active ecosystem around it.
Pepe runs on Ethereum and is directly inspired by the iconic frog meme; it hit its all-time high back in December 2024.
Shiba Inu is the original Ethereum-based "Dogecoin killer" with a massive community of 2.96 million holders.
And Dogecoin, the oldest of the four, was created in 2013 and remains one of the top 10 tokens by market cap. None of these are utility tokens in a traditional sense.
Their price moves are community-driven, sentiment-driven, and heavily influenced by social media momentum.
The Meme Coin Sector Context: Why All Four Dropped Together
When meme coins fall together, it usually means something broader is happening with market sentiment. It's not that each coin has its own individual bad news today; it's that risk appetite in the crypto market has pulled back.
Traders who were holding long positions got washed out.
Bonk's 24-hour liquidation data shows $150.41K in long liquidations out of a total $154.98K liquidated.
DOGE had $11.52M in long liquidations against $2.03M in shorts.
PEPE saw $1.37M in longs wiped out.
SHIB had $961.96K in long positions liquidated.
The pattern is the same across all four: longs got trapped, and when the price broke lower, the cascade began. And honestly, when you look at the charts, none of this is surprising.
There's also some ecosystem news in the mix, posted on X by BONK INU.
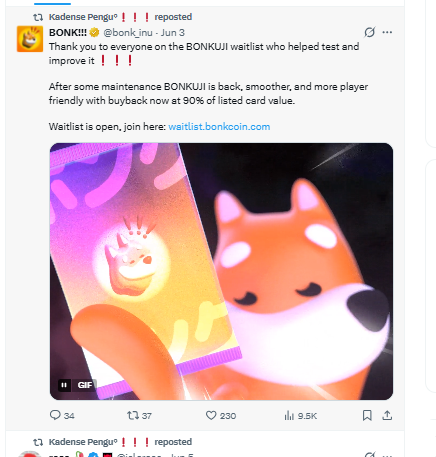
BONK's native game, BONKUJI, just relaunched after maintenance, now offering 90% buyback value on listed cards, a positive update, but it hasn't been enough to offset the broader selling pressure.
Liquidation Data
BONK: $150.41K in longs wiped out versus just $4.57K in shorts. The longs kept trying to catch the bottom. So far, they've been wrong.
DOGE: $11.52M in long positions liquidated against $2.03M in shorts. Longs were holding in bulk and got squeezed hard.
PEPE: $463.53K in long liquidations in 12 hours, and fresh shorts are being added right now. Traders aren't just selling; some are actively betting on further downside.
SHIB: $961.96K in longs wiped versus just $26.47K in shorts. Bulls kept trying to catch the bottom. The market kept proving them wrong.
Source: Data by CoinGlass
BONK Technical Analysis: Breakdown From the Channel
Source: Chart by TradingView
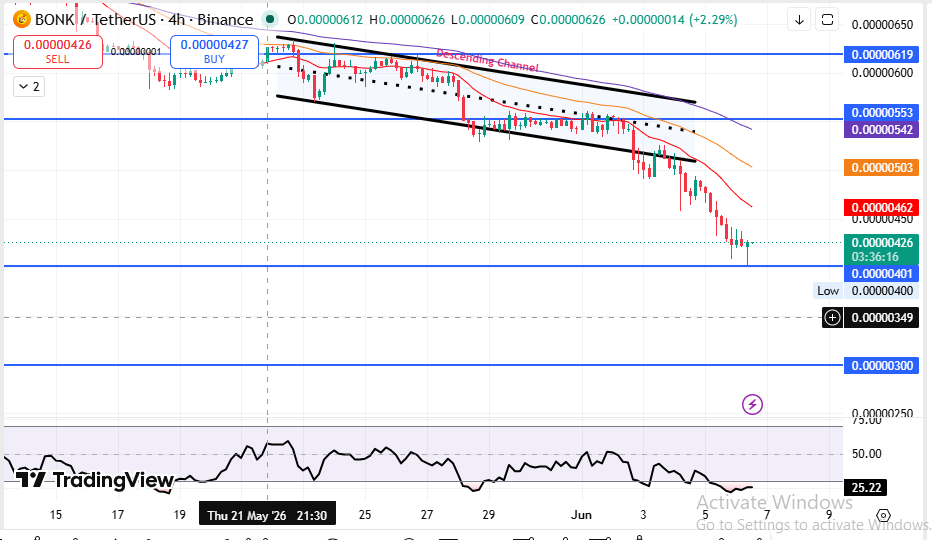
The 4-hour chart has been telling this story for weeks: patient, persistent, and not in any rush to turn around. BONK has been trading inside a descending channel since May 21.
The channel tightened progressively, and around June 4, the price broke below the lower boundary, a clean breakdown.
Right now it's sitting near $0.000004281, with EMAs at 20, 50, and 100 all stacked above price as resisistance.
That's a bearish configuration. When EMAs pile up above and the price slides beneath all of them, it signals that sellers have been in control for weeks, not just days.
The RSI is at 25.22. That's technically oversold. But oversold doesn't mean it bounces immediately; in a trending bearish move, RSI can stay oversold longer than most traders expect.
The key support to watch is $0.000004024 (today's low).
Resistance sits near the $0.00000503 area, where the 20 EMA is converging with the channel upper boundary.
DOGE Technical Analysis
Source: Chart by TradingView
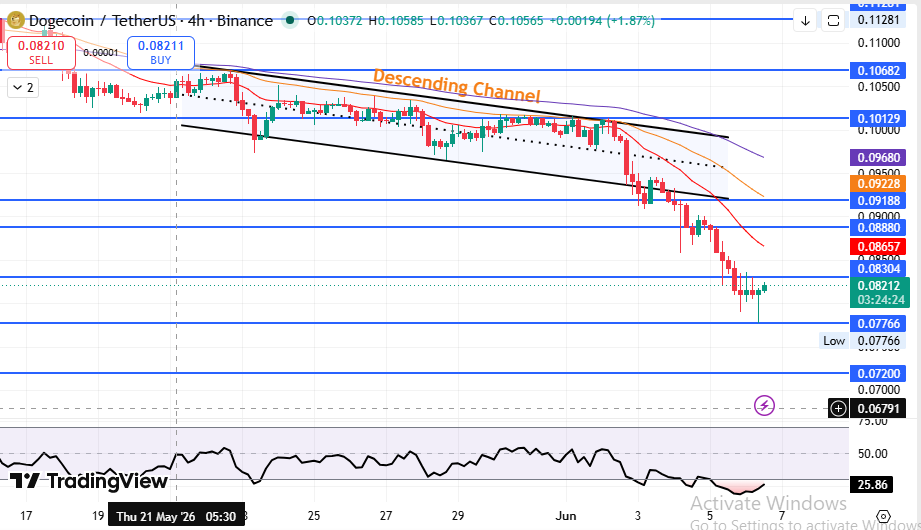
Pull up the 4-hour chart, and the story writes itself; every attempt to recover has been quietly rejected. Dogecoin's descent is the most dramatic in dollar terms because DOGE has a much larger market cap and trading volume.
Price is currently $0.08206, and the structure from May 21 onward is almost identical to the other meme coins: a well-defined descending channel, a clean breakdown near June 4, and all EMAs now sitting above.
The RSI at 25.86 is hovering just above the lowest levels of the past month. What stands out is the volume behind this move: $1.74B in 24-hour trading, which is 23.79% above average.
Key support is $0.07766, and below that, $0.07200.
Resistance sits near $0.08657 and then $0.09228, where the EMAs cluster. A close back above $0.08657 would be the first sign that sellers are losing their grip.
PEPE Technical Analysis: Same Channel, Same Story
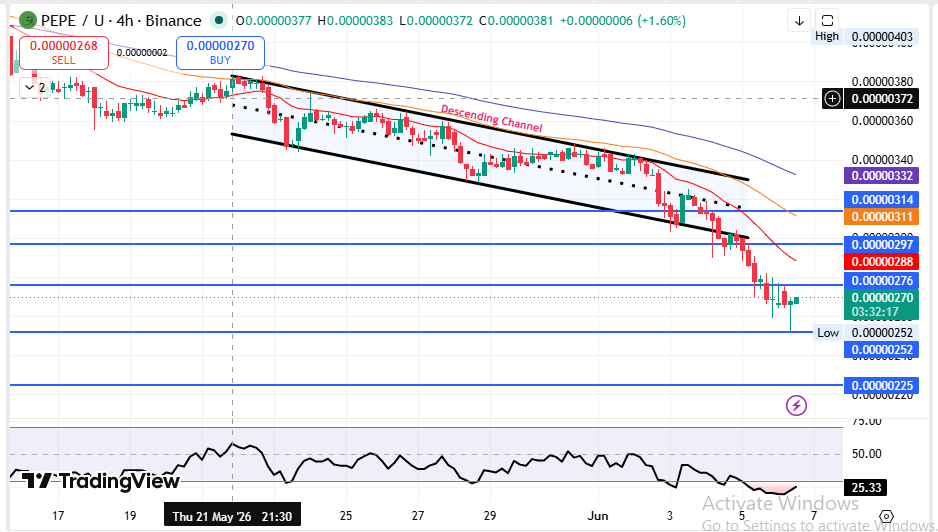
Source: Chart by TradingView
On the 4-hour timeframe, the structure has been clean and consistent; lower highs, lower lows, and no real fight from the bulls.
Pepe's chart has been running under the descending channel from May 21. Breakdown around June 4. Now trading below all three EMAs with RSI at 25.33.
The breakdown level on PEPE's chart shows price sitting near the $0.000002706 area, with support at $0.00000252. There's a thin zone near $0.00000276 and $0.00000288 that could act as minor support before the next leg.
Resistance is stacked: $0.00000297, $0.00000311, and $0.00000314 form a tight cluster just above.
SHIB Technical Analysis: The Weakest RSI of the Four
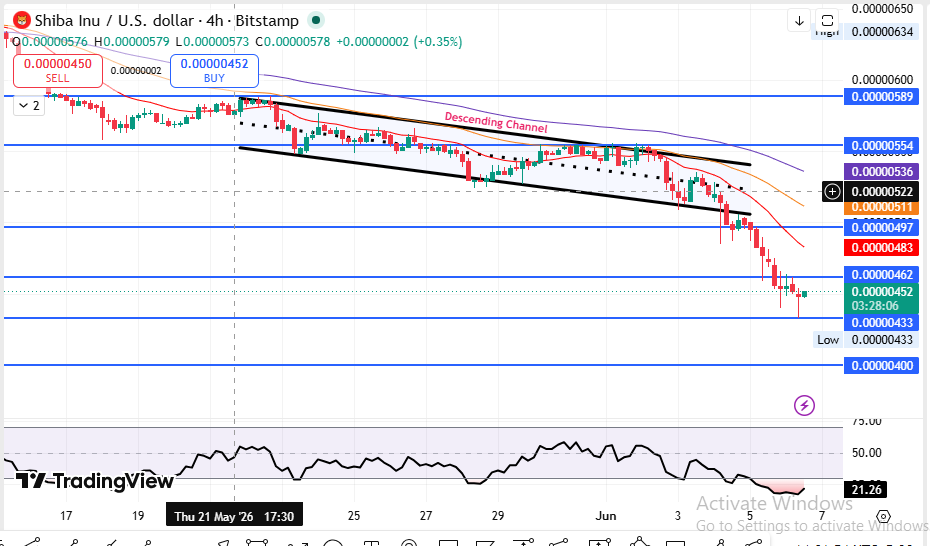
Source: Chart by TradingView
The 4-hour chart paints a picture that long holders probably don't want to look at right now. The descending channel has been holding since May 21, and the June 4 breakdown pushed price toward the $0.000004328 low seen today.
Shiba Inu's RSI reading of 21.26 is the lowest of the four coins right now. That's deeply oversold. But just like the others, oversold in a downtrend can stay oversold. The price is at $0.000004520, down 3.88%, the largest percentage drop among the four today.
All EMAs, 20, 50, and 100, are above price, trending downward. The 20 EMA is near the $0.00000511 area, the 50 EMA near $0.00000536, and the 100 EMA further above. Each one is a resistance wall on the way back up.
Key support: $0.00000433. Below that, $0.00000400 is the psychological level.
Resistance: $0.00000462, $0.00000483, and then the EMA cluster near $0.00000511.
Price Prediction: Three Scenarios for All Four Meme Coins
All four coins are in the same technical position, so the scenarios largely mirror each other:
Worst Case: RSI stays pinned near 20–25. The descending channel structure continues, and price makes fresh lows below today's support.
For DOGE, that means a push toward $0.0720.
For SHIB, $0.00000400.
For PEPE, $0.00000225.
For BONK, $0.00000300.
This plays out if Bitcoin weakens and broader risk-off sentiment continues through mid-June.
Base Case: A short-term relief bounce from oversold RSI levels. Price recovers partially toward the first resistance zone (around the 20 EMA) but fails to break back inside the channel. Range-bound chop between support and the first EMA level. This is the most likely near-term scenario.
Best Case: A catalyst, either a Bitcoin breakout above key levels or a sudden meme coin trend on social media, pushes one of these coins back inside the channel.
If DOGE reclaims $0.09228 and SHIB breaks above $0.00000511, sentiment could flip fast. Meme coins are capable of violent reversals.
Coin
Worst Case
Base Case
Best Case
Trigger
BONK
$0.00000300
Range $0.000004-$0.000005
Back to $0.00000503
BTC rally or meme trend
PEPE
$0.00000225
Range $0.000002-$0.000003
Back to $0.00000311
Social media catalyst
SHIB
$0.00000400
Range $0.000004-$0.000005
Back to $0.00000511
SHIB burn spike or news
DOGE
$0.0720
Range $0.078-$0.085
Back to $0.09228
BTC strength or celebrity push
Key Price Levels to Watch Across All Four Coins
BONK:
Resistance: $0.00000503 (20 EMA), $0.00000542–$0.00000553
Support: $0.000004024 (today's low), $0.00000400
Invalidation: Break below $0.00000349
PEPE:
SHIB:
Resistance: $0.00000462, $0.00000483, $0.00000511 (20 EMA)
Support: $0.00000433, $0.00000400
Invalidation: Break and close below $0.00000400
DOGE:
Resistance: $0.08657, $0.09228, $0.09680
Support: $0.07766 (today's low), $0.07200
Invalidation: Weekly close below $0.07200
What the Chart Setup Is Saying Right Now
When we pulled up all four charts together, the first thing that stood out was how synchronized the breakdown was. May 21 to June 4: all four inside descending channels, all four breaking at nearly the same time.
That's a sector move, not a coin-specific event. The RSI on SHIB is the most extreme at 21.26, which means it's the most oversold of the four but also potentially the closest to a technical bounce if buying pressure shows up.
The EMA structure is clear: 20, 50, and 100 EMAs are all stacked above price on every chart, all sloping downward.
Until at least the 20 EMA flips from resistance to support, the trend is down. Analysts aren't divided here. The chart is bearish.
The liquidation data is bearish. The only open question is whether a relief bounce is near.
And here's the thing: sometimes the most bearish charts produce the sharpest bounces. That's the part the data can't fully predict.
Final Thoughts: What Matters Most Right Now
The most important levels right now are DOGE's $0.07766 and SHIB's $0.00000433, today's lows.
If these hold as support into the weekly close, there's a case for a short-term bounce. If they break, the next leg lower opens up fast. Pepe and Bonk are smaller and more volatile, which means their moves will be amplified in either direction.
RSI is oversold. But the trend is still down. Watch the levels.
DISCLAIMER: This article is for educational purposes only and does not constitute financial advice. Crypto markets are volatile. Consult your investment advisor before making investment decisions.