Can buyers defend $1.00 before the wedge snaps? MRX price today is $1.03 on Nov 5, 2026 at 04:04 UTC, and the 4-hour chart is squeezing into a falling wedge, a pair of down-sloping lines that
Can buyers defend $1.00 before the wedge snaps?
MRX price today is $1.03 on Nov 5, 2026 at 04:04 UTC, and the 4-hour chart is squeezing into a falling wedge, a pair of down-sloping lines that converge.
This Mirex Network price prediction leans bullish while $1.00 holds, though theMirex Network investment case still rests on thin trading. Sellers have won the last three weeks.
MRX Price Today: Data Snapshot
Metric
Value
Price
$1.03
24H change
-1.53%
6H, 1H, 5M change
+0.85%, +0.29%, +0.44%
24H volume
$22K
Liquidity
$54K
Market cap and FDV
$27.8M
Numbers come fromlive DEX Screener pair data, captured Nov 5, 2026, at 04:04 UTC.
But a $54K pool behind a $27.8M valuation matters later, since the MRX token supply sits at 27.0M and every token is already counted.
Why MRX is Moving Today? The Lumira Update
Mirex Network says Lumira mining balances are restored, in anofficial X update posted about 20 hours before the screenshot.
Spin and Win rewards come next.
The post pulled 469 likes, 58 reposts, and 15K views. And price barely flinched, with the 6-hour reading at +0.85% and the 24-hour at -1.53%.
The Mirex Network and Lumira story helps trust. A fix doesn't add buyers by itself.
Mirex Technical Analysis: The Base and the Breakout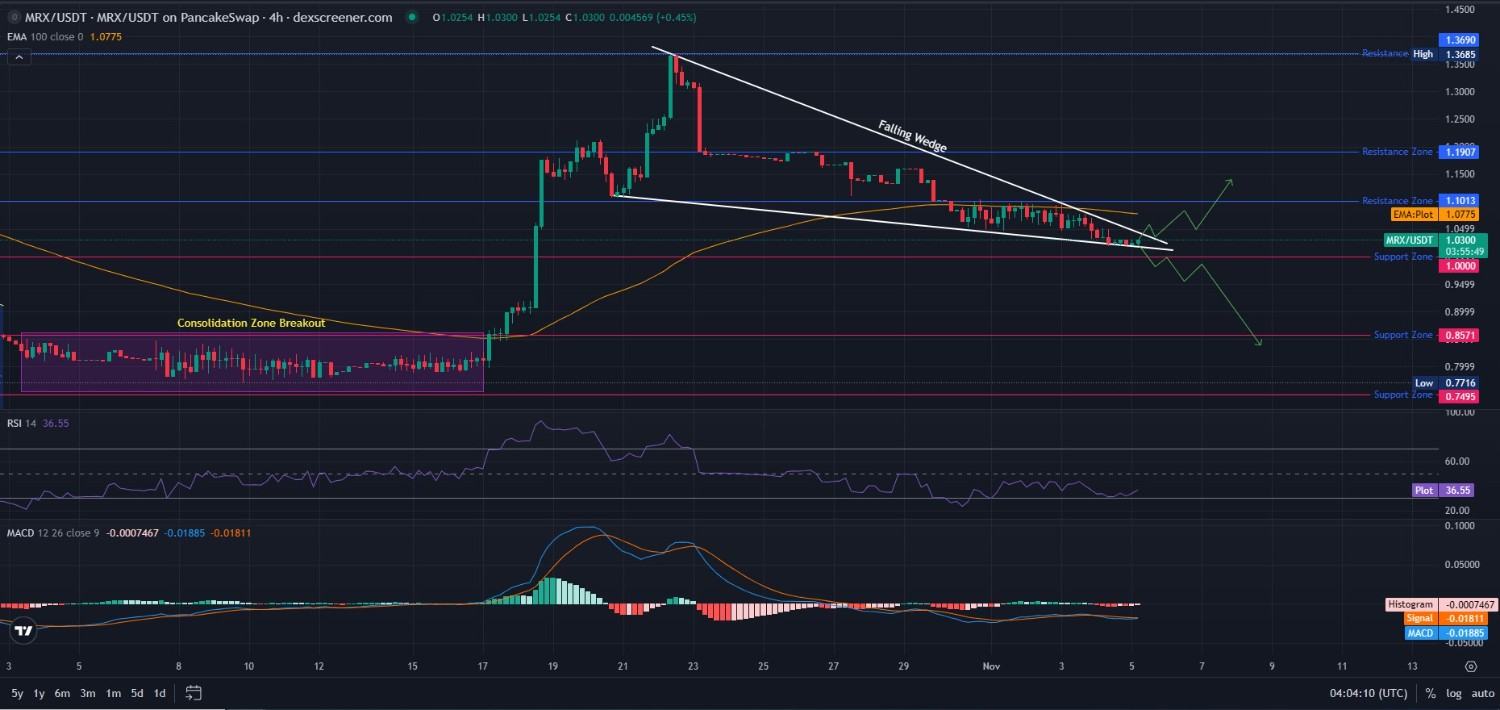
Start at the left edge of the 4-hour chart. The price was chopped between roughly $0.77 and $0.86 for 2 weeks.
Candles stayed small, and RSI hovered near the midline. Sellers couldn't break $0.7716. Buyers couldn't clear $0.8571.
And then a tall green candle cleared $0.8571 in a single push, with price climbing in steps toward $1.19. Theearlier range breakout watch flagged that squeeze at $0.8215 on Oct 15, 2026, at 10:30 UTC.
Rally Peak, Overbought RSI, and the Slide
The run topped at $1.3685, about 60% above the old $0.8571 ceiling, and the RSI spiked far past 70, the overbought line.
One 4-hour red candle wiped out about $0.17, dropping the price from $1.3685 to near $1.19. Spikes like that rarely hold, as theoverbought RSI levels show.
But sellers weren't done. They pushed under $1.1013 and beneath the 100 EMA, a moving average of the last 100 candles. Each bounce got shorter, with highs and lows both falling.
Falling Wedge, EMA, and MACD Right Now
The upper wedge line runs from the $1.3685 peak, while the lower line links the swing low near $1.11 to the latest candles at $1.03.
Price has traded under the 100 EMA at $1.0775, 4.6% above spot, since the slide through $1.10. RSI reads 36.55, weak but above the 30 oversold line.
MACD, which compares a pair of moving averages to gauge momentum, shows the line at -0.01885 under the signal at -0.01811. Histogram? Only -0.0007467. Selling pressure is nearly spent.
Bearish? Mostly, going by the EMA. Strike that; a falling wedge leans bullish, and the flat histogram agrees.
Everything hinges on a single line. The lower edge of the wedge. Therally watch levels show how earlier pushes stalled.
Thin Liquidity and Whale Wallets Behind the Chart
MRX trading volume analysis starts with $22K over 24 hours, split evenly at $11K buys and $11K sells. Only 6 traders took part, with 5 buyers and 3 sellers.
Volume was $17K across 21 traders.
Is a $54K pool enough to carry a $27.8M valuation? MRX whale wallet holdings make it worse, since the top wallet owns 9.88%, or 2.6M tokens worth $2.7M.
That's roughly 50 times the pool, the MRX liquidity risk in a single number, and thepool depth analysis shows the math.
MRX Support and Resistance Levels
MRX support and resistance levels are easy to map here. Support starts at $1.00, a round number, then $0.8571 (the old breakout line) and $0.7495, with the range low at $0.7716 just above.
Resistance starts at the wedge's upper line near $1.05. Next comes the 100 EMA at $1.0775, then $1.1013 and $1.1907, with the $1.3685 high capping everything.
And a 4-hour candle trading above $1.0775 on volume over $22K confirms a breakout. Breakdown needs 2 consecutive 4-hour candles trading under $1.00, and thepool cost ladder adds cost-basis context.
Mirex Network Price Prediction: Breakout and Breakdown Paths
The wedge tip is a few trading days away, so this MRX price breakout prediction comes down to which edge gives way first.
Scenario
Trigger
Target
Invalidation
Liquidity Condition
Bull
4-hour candle trading above $1.0775
$1.1013, then $1.1907
Trading back under $1.00
Volume above $22K, buys outnumber sells
Base
Price holds between $1.00 and $1.0775
$1.00 to $1.08 range
Break of either edge
Volume near $22K, pool near $54K
Bear
2 consecutive 4-hour candles trading under $1.00
$0.8571, then $0.7495
Reclaiming $1.0775
Thin pool, sell volume above buy volume
This MRX price prediction favors the bull path while $1.00 holds. A full MRX price recovery toward $1.3685 needs far more volume, which atier 1 listing scenario would supply.
Risks That Could Change the Mirex Network Price Prediction
A Mirex Network major exchange listing isn't confirmed in the data used here, so upside leans on a $54K pool.
But a large sell from the top wallet would reset every level above. Contract and links deserve checking on theofficial Mirex website before any wallet connects.
Disclaimer: This article is for information only and isn't financial, investment, or trading advice. Crypto, especially small-cap tokens on decentralized exchanges, carries high risk, including total loss. Scenarios aren't forecasts or guarantees. Data was captured on Nov 5, 2026, at 04:04 UTC, and changes fast. Readers should do their own research first.