This Nillion price prediction follows theprice prediction hub format, with NIL price today near $0.1396. Turns out, that's 37.8% higher in 24 hours. Price escaped a range that has held since
This Nillion price prediction follows theprice prediction hub format, with NIL price today near $0.1396.
Turns out, that's 37.8% higher in 24 hours.
Price escaped a range that has held since November 2025. Support sits at $0.08198, and resistance waits at $0.15116.
Encrypted Markets is the catalyst. An RSI of 91 is the risk.
Nillion Quick Prediction Box
Metric
Current Snapshot
NIL Price / 24H
$0.1396 / +37.8%
Market Cap / Volume
$70.591M / $150.455M
Trend
Bullish (above 100D EMA, MACD above zero)
RSI (14D) / MACD
91.00 / Bullish
Support / Resistance
$0.08198 / $0.15116
Next Target
$0.22715
Bull / Base / Bear
$0.22-$0.35 / $0.09-$0.17 / $0.04-$0.08
Invalidation
Daily trade below $0.08198
Analysis timestamp: 24 September 2026, 09:07 UTC.
Nillion Price Prediction: Current Market Snapshot
Nillion price today reads $0.1396 onCoinGecko's live NIL page, ranked #380.
Market cap is $70.591M. And volume hit $150.455M, about 2.1 times that.
Circulating supply is 504.192M of 1.011B. All-time highs sit 84.4% higher.
Nillion Price Prediction for Today and This Week
Two windows matter. Each gets its own read.
NIL Price Prediction for the Next 24 Hours
Breaking: The NIL price prediction today starts with a 37.8% surge. Volume exploded. RSI hit 91.
Expected range: $0.122 to $0.151. Support is $0.122, resistance $0.15116.
The breakout trigger is a full daily candle trading above $0.15116 on rising volume.
NIL Price Prediction for the Next 7 Days
NIL price prediction this week favors $0.10 to $0.15. Sector flow fromAI crypto news can push either way.
Volume above $100M a day keeps the move alive. But a fade invites a retest of $0.10.
Nillion Technical Analysis: RSI, MACD and Trend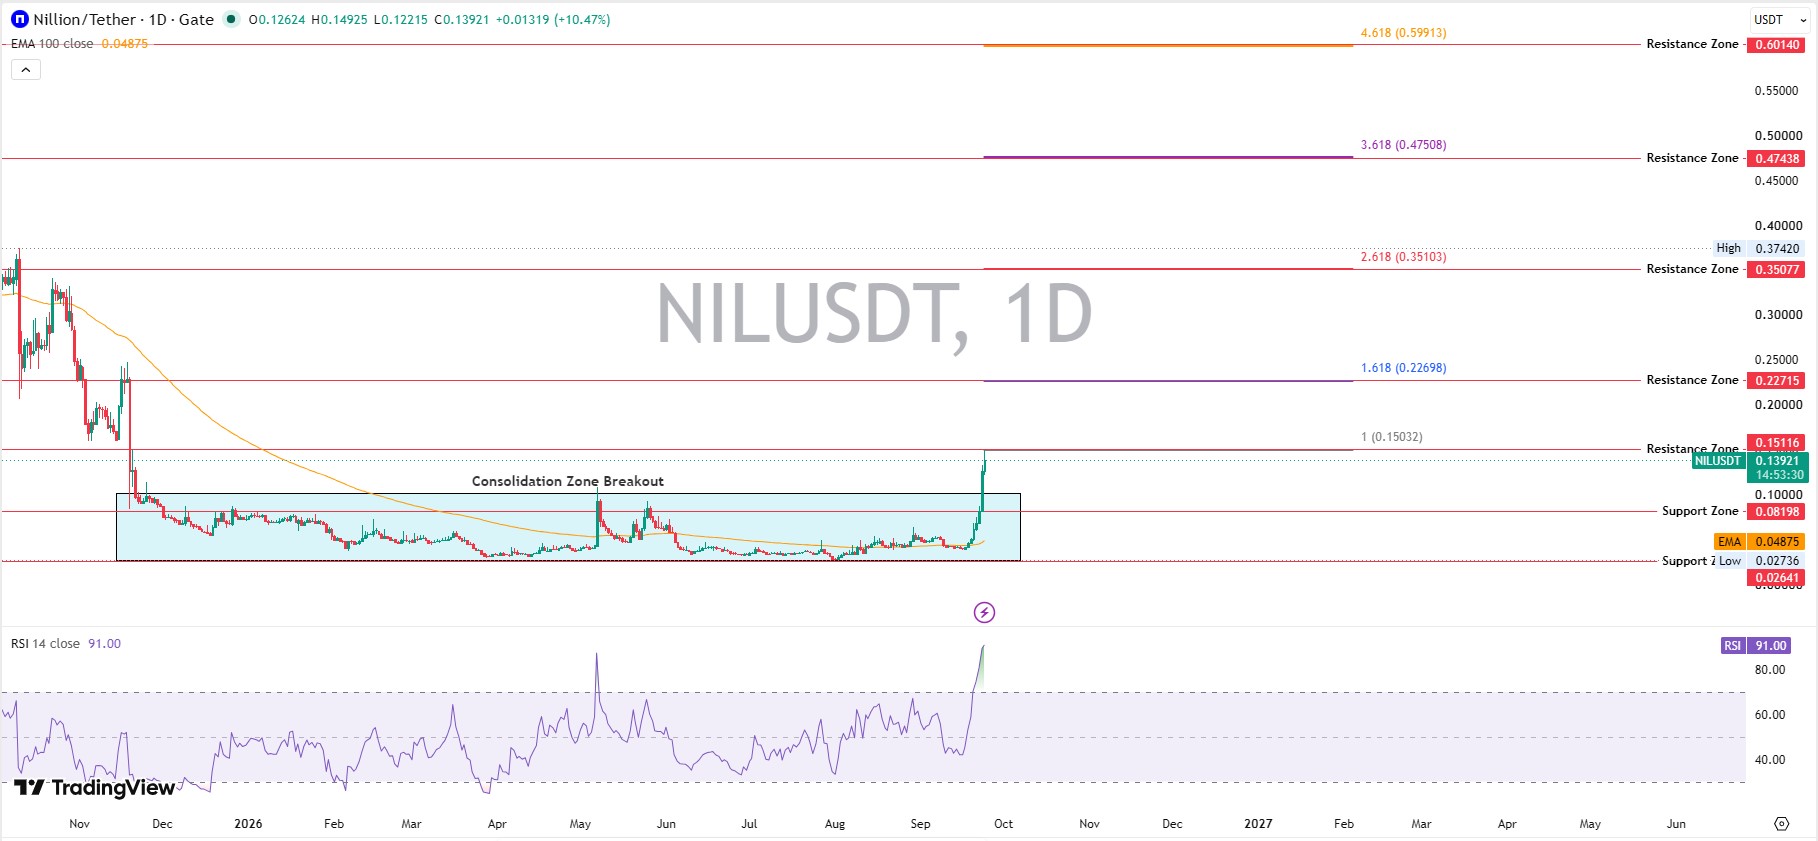
Trend reads bullish: price trades above the 100D EMA and MACD sits above zero.
$NIL RSI Analysis
RSI, or Relative Strength Index, scores momentum from 0 to 100. Above 70 means overbought.
NIL RSI reads 91.00 on the 14-day setting, with no bearish divergence yet.
When we pulled up thedaily NILUSDT chart, the RSI line had gone nearly vertical. Here's the thing: 91 rarely lasts.
Bullish at first glance. Then the reading landed, and the view changed: pullback setup, not a chase.
Nillion MACD Analysis
MACD, or Moving Average Convergence Divergence tracks momentum through two averages.
NIL MACD shows 0.01539 against a signal line at 0.00575, with a histogram of 0.00965. When we checked, those bars were the tallest since the range began.
Basically, momentum is accelerating. But what happens when a 91 RSI meets resistance at $0.15116?
$NIL Moving Average Structure
The 100D EMA, an average weighting recent trades more, sits at $0.04875. Price trades about 2.9 times above it.
The 20D tracks momentum, the 50D the mid trend, and the 200D the cycle. None were plotted.
$NIL Support and Resistance Levels
Levels are defined manually from the daily chart, not copied from exchange labels.
Key Support Levels
Support levels are $0.10, $0.08198, and $0.02641, the range floor.
Liquidity often followsexchange listing updates.
Key Resistance Levels
Resistance levels are $0.15116, $0.22715, $0.35077, $0.47438, and $0.60140.
Two conditions flip resistance into support: a full daily trade above, then a retest that holds.
NIL Breakout and Breakdown Levels
Bullish confirmation:a full day trading above $0.15116 with volume over $100M.
Bearish confirmation:a full day trading below $0.08198 with volume rising on the selloff.
$NIL Price Prediction 2026
Nillion price prediction 2026 uses scenarios, not one arbitrary target. Dates on thecoin events calendar can shift them.
Scenario
2026 Range
Conditions
Bear
$0.04-$0.08
Support failure, weak demand
Base
$0.09-$0.17
Consolidation, moderate adoption
Bull
$0.22-$0.35
Breakout, adoption, liquidity
$NIL Price Prediction 2027
Nillion price prediction 2027 hinges on adoption and the market cycle. At 700M circulating supply, a $90M-$150M market cap gives $0.13-$0.21.
Nillion Price Prediction 2028
Nillion price prediction 2028 assumes 850M circulating. A $120M-$220M market cap gives $0.14-$0.26.
$NIL Price Prediction 2029
$NIL price prediction 2029 assumes 950M circulating. A $150M-$300M market cap gives $0.16-$0.32, thoughpresale and ICO listings compete for liquidity.
$NIL Price Prediction 2030
$NIL price prediction 2030 is market-cap-driven. Target Price = Assumed Future Market Cap ÷ Assumed Future Circulating Supply.
At 1.011B supply, $200M-$500M gives $0.20-$0.49. Bull at $1B gives about $0.99.
$NIL Bull, Base, and Bear Case
Bull Case
Trigger: daily trade above $0.15116.
Catalyst:Encrypted Markets adoption.
Confirmation:RSI cools but holds above 50.
Target:$0.22-$0.35. Invalidation: below $0.10.
Base Case
Bear Case
Trigger: support failure, supply pressure, weak altcoins.
Pressure: rotation intomemecoin news themes.
Target:$0.04-$0.08. Invalidation: reclaim of $0.15116.
$NIL Catalysts and Risks
$NIL Bullish Catalysts
Nillion'sofficial roadmap thread outlines Encrypted Markets. Developers pay in NIL, operators stake it, and rewards arrive in NIL.
Ethereum-based contracts, developer adoption, and exchange liquidity help. Nillion 2.0 and mainnet upgrades stay roadmap items until delivered.
NIL Risks
Token emissions, unlocks, and thin liquidity can overwhelm demand. Trackingcrypto airdrops helps spot fresh supply.
Volatility, competition, failed adoption, and BTC weakness add pressure. Fake contracts circulate too.
$NIL Tokenomics and Supply Pressure
Circulating supply is 504.192M against 1.011B total. About 507M tokens haven't reached the market.
Fully diluted valuation is $141.498M versus a $70.591M market cap. Fine.
The unlock schedule wasn't verified, so the next major unlock stays unconfirmed. Any release could equal roughly 100% of the current circulating supply.
Etherscan holder data shows the top 100 wallets hold 94.22%. A few sellers can crush prices.
What Could Make NIL Break Out or Break Down?
Signal
Bullish
Bearish
Price
Reclaims resistance
Loses support
RSI
Holds above 50
Falls below 40
MACD
Bullish cross
Negative momentum
Volume
Expands on breakout
Expands on selloff
BTC
Stable or rising
Sharp correction
Unlocks
Demand absorbs supply
Selling pressure rises
Verdict: the setup is overheated. A pullback toward $0.10 beats a straight run.
Disclaimer: This article is for information only and isn't financial advice. Crypto is volatile, and forecasts can fail. Research independently before trading.