PAX Gold Price Prediction interest is climbing again, and a tightening weekly chart is the reason. Compare that to the Bitcoin price prediction coverage, where a much larger market is fightin
PAX Gold Price Prediction interest is climbing again, and a tightening weekly chart is the reason.
Compare that to the Bitcoin price prediction coverage, where a much larger market is fighting its own squeeze this month.
PAXG is showing a similar pattern, just on gold-backed terms. Fresh volume data from major exchanges places PAX Gold's daily activity above $100 million across venues like Binance and WhiteBIT.
PAX Gold launched in 2019 as a token backed one-to-one by physical gold held in vaults, giving holders exposure to bullion without storing metal themselves.
Each PAXG token tracks the price of one fine troy ounce of gold. And that peg is part of why this PAX Gold Coin trades so differently from most crypto assets.
PAXG is trading near $4,280.74, up 0.2% on the day. Market cap sits around $1.862 billion, with circulating supply close to 434,898 tokens.
PAX Gold Price Today reflects a metal-backed asset moving in a much tighter range than typical altcoins.
Live Market Data
Metric
Value
Price
$4,280.74
24H Change
+0.2%
24H Range
$4,254.67 - $4,307.53
Market Cap
$1.862B
Source: market data taken from CoinGecko, as of Sep 26, 2026. Figures may vary slightly across other tracking websites.
PAX Gold Volume by Exchange
PAX Gold trading activity skews heavily toward two venues. Binance leads with $54.10 million in 24-hour volume, followed by WhiteBIT at $26.68 million. 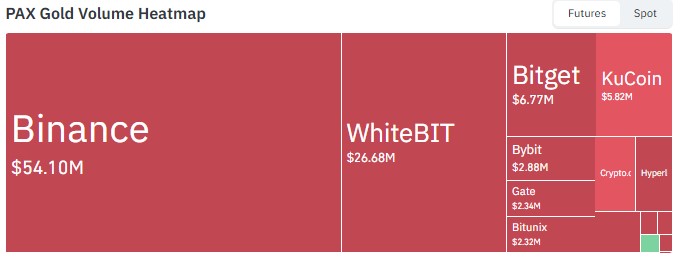
Source: Volume Heatmap Data Taken From CoinGlass, As of Sept 26, 2026.
Bitget and KuCoin trail behind at $6.77 million and $5.82 million.
Smaller venues like Bybit, Gate, and Bitunix each carry under $3 million. And that's a concentrated liquidity picture, not a spread-out one.
PAXG Holder Concentration
Holder data paints a lopsided picture. Whale wallets make up just 1.97% of all holders but control 86.27% of PAXG's market cap. The top ten holders alone account for 34.49% of supply.
Tier
Holder Count
% of Market Cap
Whale
1,733
86.27%
Shark
6,365
10.86%
Dolphin
12,382
2.52%
Fish
15,845
0.31%
Crab
14,153
0.03%
Shrimp
37,401
Under 0.01%
Source: Holder Data Taken from Etherscan.
A Gini distribution score of 0.9776 confirms it. Concentration this tight means large wallets can move prices fast, in either direction.
Technical Analysis
This PAX Gold Technical Analysis starts with the shape squeezing price on the weekly chart.
PAXG sits inside a symmetrical triangle, a pattern formed by a falling trendline from above and a rising trendline from below narrowing toward a point. 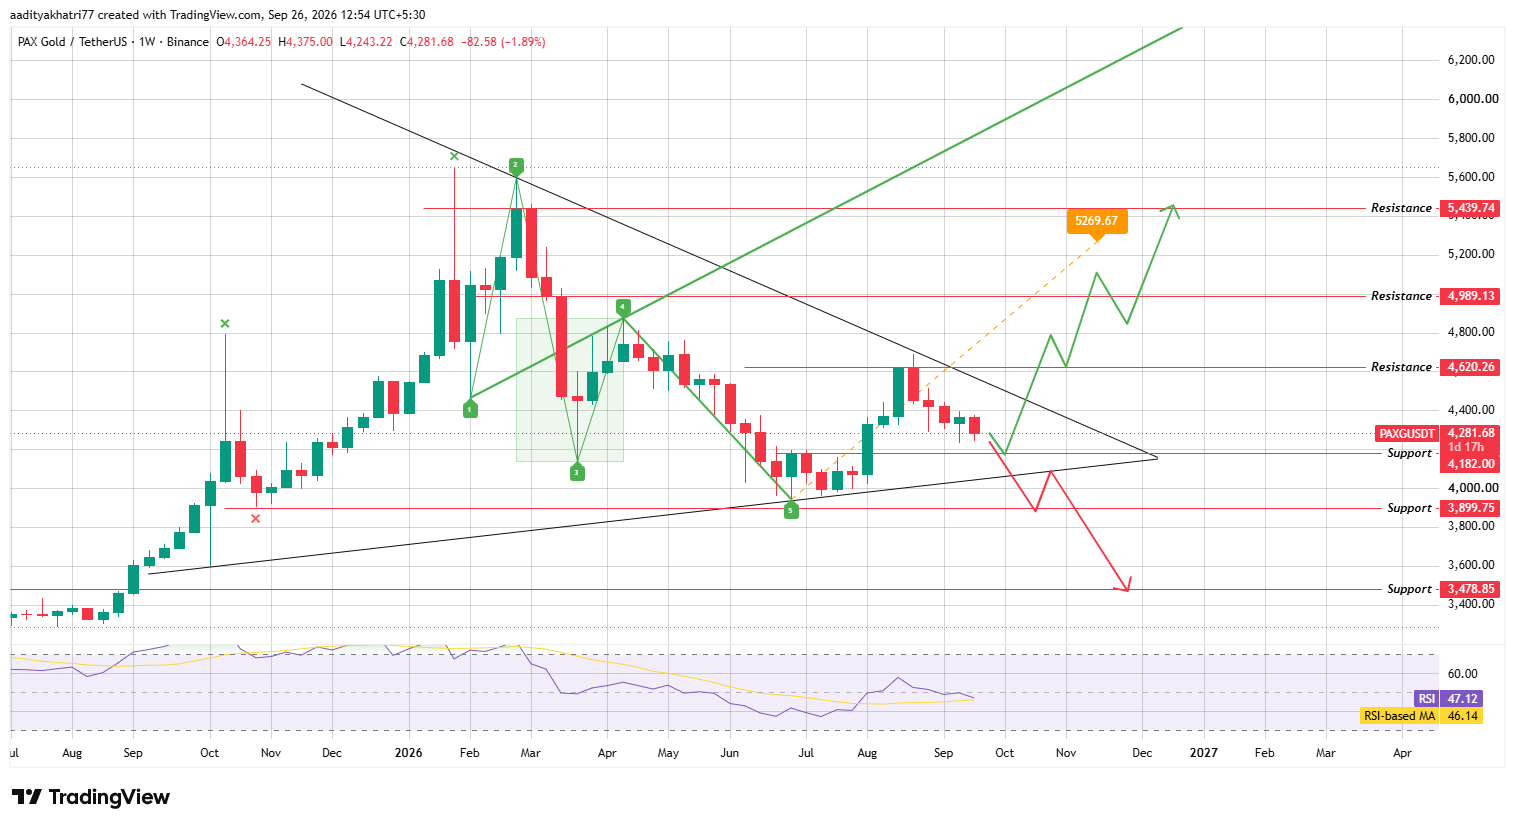
Source: Chart taken from TradingView, as of Sep 26, 2026
RSI reads 47.12, just below its moving average of 46.14.
That's a soft, slightly bearish lean right now. But the triangle's apex is still months away, leaving room for either side to take control.
Can PAXG Push Toward Higher Resistance?
A bounce off support followed by a weekly trade above the falling trendline, backed by real volume, opens the path toward $4,620.26 first. Clear that zone and $4,989.13 comes into view.
A wolfe wave structure on the same chart marks five swing points and projects an extended move toward $5,439.74 if buyers stay in control.
That's the bullish case. And it needs volume behind the break, not just a stray weekly wick.
What Happens If PAXG Breaks Support?
Rejection at resistance flips the setup fast. And a break of the support zone near $4,182.00 and the rising trendline below it would send PAXG hunting for $3,899.75. Lose that too, and $3,478.85 becomes the next real floor.
Breakdowns from triangles this wide tend to move slower than crypto-native charts. Fine. Gold-backed assets rarely crash overnight the way meme coins do.
Support
Resistance
$4,182.00
$4,620.26
$3,899.75
$4,989.13
$3,478.85
$5,439.74
Bull, Base, and Bear Scenarios
Scenario
Setup
Level
Bull
Trendline break with volume
$4,620.26 to $5,439.74
Base
Triangle holds, range trade
$4,182.00 to $4,620.26
Bear
Support and trendline break
$3,899.75 to $3,478.85
PAX Gold vs Bitcoin
Bitcoin trades on risk appetite, while PAXG tracks a physical commodity most investors treat as a hedge against that same risk.
When Bitcoin sells off hard, PAXG has historically held up better, though it isn't immune to broad crypto-market liquidity crunches.
That relationship matters more here than in most token comparisons.
Methodology
This PAX Gold Price Prediction was built from a weekly PAXGUSDT chart sourced through Binance via TradingView, checked candle by candle for the triangle boundaries and the Wolfe wave swing points.
Support and resistance levels came directly from the marked price zones on that chart.
Live price, market cap, volume, and holder figures came from separate data snapshots taken the same day.
Nothing here substitutes for independent research; markets move fast, and a chart pattern only describes probability, not certainty.
Expert Opinion
Market commentary around PAX Gold News this month leaned neutral to cautious.
Analysts tracking gold-backed tokens noted that PAXG's tight holder concentration means large wallets carry outsized influence over near-term direction.
Turns out, a metal peg doesn't remove volatility entirely; it just changes what drives it.
Disclaimer: This article is for informational purposes only and does not constitute financial advice. Cryptocurrency and gold-backed markets, including PAX Gold, carry volatility and downside risk; prices can move sharply against any projected level, and past performance offers no guarantee of future results. Readers should conduct independent research before making any investment decision.
