


PEPE Price Climbs 11% as Bullish Structure Holds Steady
 BULLISH
 MASS
MASS
 TRUMP
TRUMP
 XMM
XMM
 PEPE GOLD
Key Insights:
- PEPE gains 11% weekly as rising channel structure holds, supported by consistent higher lows and strong demand across key support levels
- On-chain activity increases as price A divergence turns positive, showing network growth outpacing price and reinforcing underlying demand for PEPE
- Momentum indicators, including RSI and MACD, show early bullish recovery signals, while resistance near $0.00000408 continues to limit immediate upside breakout potential
PEPE has returned to the spotlight after gaining about 11% over the past week, reversing a period of low activity and fading interest. Besides the price recovery, the move reflects a shift in short-term sentiment as buyers gradually regain control. Consequently, the token now trades with renewed attention after several weeks of limited movement.
On the four-hour chart, PEPE continues to trade within a rising parallel channel, confirming a steady upward trend. Moreover, the price has consistently formed higher lows while respecting both boundaries of the channel. Hence, this structure signals ongoing demand as buyers defend key support levels across the trend.
Resistance Test Signals Short-Term Pressure
PEPE recently approached the upper boundary of the channel, showing continued buying interest near resistance. However, sellers reacted near this level, leading to a minor rejection and hinting at short-term exhaustion. Additionally, this movement suggests that the price could retest mid-channel support before any further upside attempt.
Technical indicators present a balanced outlook, supporting the ongoing recovery without showing extreme conditions. The Relative Strength Index remains near 64, indicating strength while leaving room for further gains. Moreover, the Awesome Oscillator has turned positive again, confirming a return of bullish momentum after a brief pause.
On-Chain Activity Strengthens Market Confidence
On-chain data shows increasing participation, reinforcing the current upward trend. Significantly, the Price to Daily Active Addresses divergence has turned positive, indicating that user activity grows faster than price movement. Consequently, this alignment reflects stronger underlying demand supporting the current recovery phase.

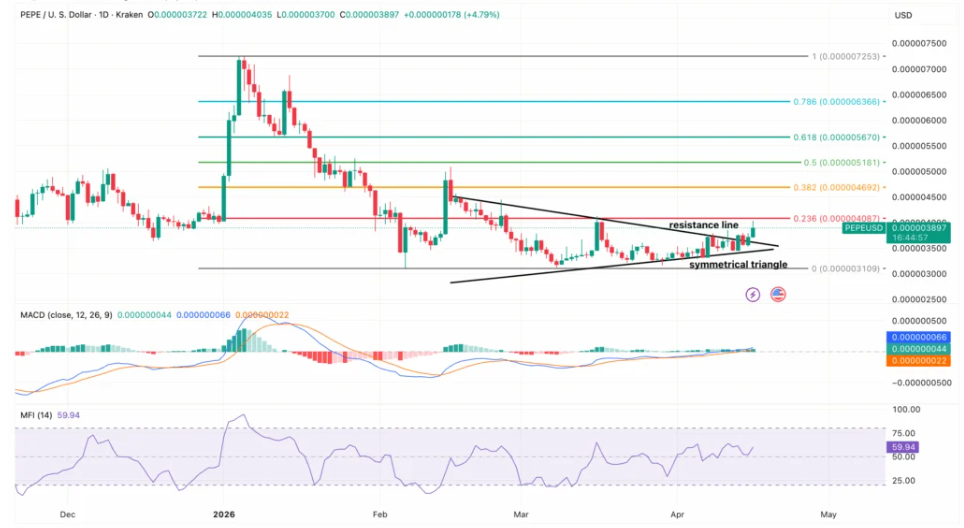
On the daily timeframe, PEPE has broken above its symmetrical triangle resistance, tightening the trading range. However, the price still faces resistance near the 0.236 Fibonacci level around $0.00000408. Besides repeated rejections at this level, buyers continue to test the zone, signaling ongoing pressure.
Indicators Point to Early Momentum Recovery
The moving average convergence divergence shows a mild bullish crossover, while the histogram turns slightly positive. Additionally, the Money Flow Index remains near 60, reflecting steady capital inflow without overbought conditions. Hence, these signals indicate early-stage momentum recovery rather than a strong breakout phase.
If PEPE breaks above the resistance trendline and reclaims the 0.236 level, the price could move toward $0.0000047. Moreover, stronger momentum may push the token closer to $0.0000055 in a bullish scenario. However, a drop below key support at $0.00000345 could shift the trend and expose lower levels near $0.0000031.
The post PEPE Price Climbs 11% as Bullish Structure Holds Steady appears on Crypto Front News. Visit our website to read more interesting articles about cryptocurrency, blockchain technology, and digital assets.
