PEPE has broken above its long-term descending channel, but the 24-hour chart shows sellers resisting further recovery. The $0.000005036 reference level and $0.00000485 support area offer imp
- PEPE has broken above its long-term descending channel, but the 24-hour chart shows sellers resisting further recovery.
- The $0.000005036 reference level and $0.00000485 support area offer important tests for PEPE's next move.
- Promotional claims of 100x presale returns remain unverified, while transaction screenshots do not establish a link to PEPE.
PEPE is testing a possible trend reversal after breaking above a descending channel, although recent trading shows renewed selling pressure near important short-term levels.
PEPE Breakout Meets Renewed Selling Pressure
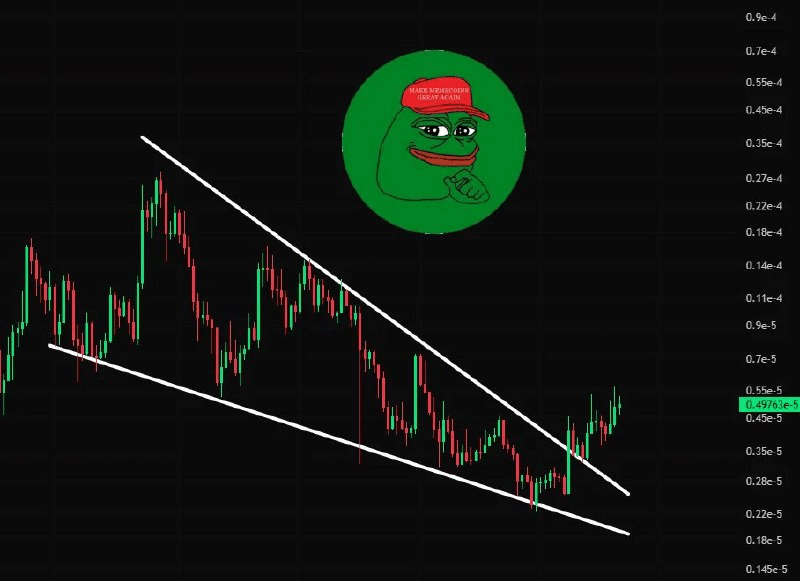
CryptoJack raised the question of whether PEPE could become a cycle winner. The accompanying long-term chart shows price escaping a broad descending channel. That move followed an extended period of lower highs and lower lows.
Source:
X
The channel's upper boundary repeatedly restricted previous recovery attempts. Meanwhile, its lower boundary tracked the prolonged decline. A rebound from that lower region eventually carried price above resistance.
The latest breakout changes the chart's immediate technical structure. Several candles moved beyond the descending upper trendline. However, the move still requires follow-through before confirming a sustained reversal.
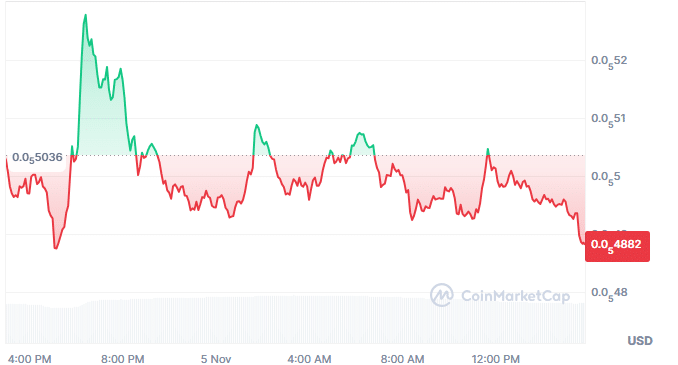
The chart's displayed marker was approximately $0.0000049763. That reading belongs to the earlier chart snapshot. A separate 24-hour snapshot later showed PEPE trading at $0.000004885.
Short-Term Trading Shows Sellers Regaining Control
The 24-hour chart records an early decline toward approximately $0.00000485. Buyers then drove a sharp recovery above $0.0000052. That advance failed as sellers returned near the session peak.
Source:
Coinmarketcap
Subsequent rebounds produced lower highs across the displayed trading period. The other $0.0000051 was also lost. The midday recovery was similar, with a weakening process commencing soon after.
PEPE ultimately breached below the $0.000005036 level of support. The displayed daily change stood at negative 2.07%. Meanwhile, reported trading volume increased by 2.29% during the same period.
The $0.00000485 area remains an immediate downside reference. If the price drops below this level, the $0.0000048 area may be exposed. On recovery, buyers would need to reclaim $0.0000050 and $0.000005036.
Transaction Records and Presale Claims Require Verification
18 transfers are listed in a separate report from Bitcoinprof0637, on October 19, 2026. The number of units that they display adds up to 43.65 million, but the asset itself is not known. The largest transfer was 14.25 million units, followed by five million.
The screenshots do not identify the receiving wallets' owners. Nor do they establish any connection with PEPE or SPEPE. Transaction hashes and verified wallet records would be needed to establish that link.
A promotional message attributed to Bitcoin Professor advertises several memecoin opportunities. It claims more than $5 million in monthly trading profits. It also names TRUMP and SPEPE as potential upcoming winners.
The message further advertises a 400 SOL giveaway. It claims a 50 SOL SPEPE presale investment and requests direct SOL payments. Its stated minimum contribution is 0.5 SOL, with promised token allocations.
The promotion also predicts a 100-fold listing-price increase. Such projections remain claims rather than confirmed returns. Combined with the transfer screenshots, they provide no independent proof of presale legitimacy.
PEPE's technical position therefore remains the clearest measurable part of the available material. Long term breakout is still pending while short term selling has returned. If the price breaks above the former resistance area, the bulls would be in a strong position. Conversely, renewed losses below nearby support would weaken it.