


Solana Price Weakens as Bearish Pattern Builds Below $90
 BULLISH
 SOL
SOL
 ETF
ETF
 BTC
BTC
 APRIL
APRIL
Key insights
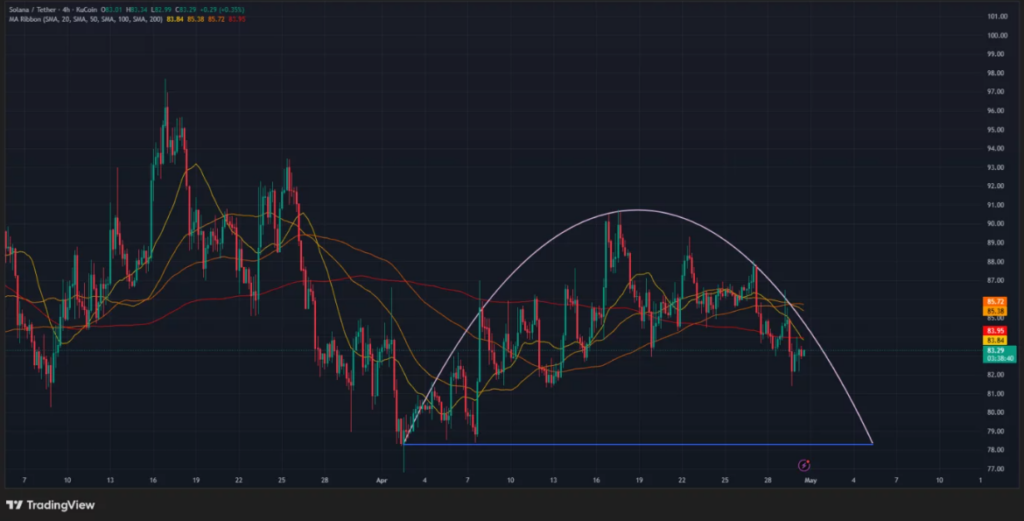
- Solana trades near $83 after repeated rejection below $90, forming a rounded top pattern that signals weakening bullish momentum across lower timeframes.
- The $78 to $80 support zone remains critical, as a breakdown could trigger further downside toward $75 and possibly extend losses toward $70.
- Slowing on-chain activity, stalled ETF inflows, and a large exchange transfer have increased selling pressure, reinforcing the current bearish outlook for Solana.
Solana traded near $83 to $85 on April 30 after failing to sustain gains above the $90 level. Price action showed repeated rejection between $88 and $90, signaling fading bullish strength. Consequently, the asset has started to reflect broader caution across the crypto market.
On the 4-hour chart, a rounded top formation has developed, indicating a gradual shift from buying interest to persistent selling pressure. This structure often precedes downside continuation once support breaks. Moreover, the pattern highlights weakening momentum after an extended attempt to hold higher levels.
Key support under pressure
The neckline of this formation sits between $78 and $80, an area that has provided consistent support throughout April. A decisive move below this zone could trigger accelerated selling. Additionally, traders are closely watching this level as it defines the near-term market direction.
Short-term moving averages have started to converge and turn lower, reflecting reduced trend strength. Price now trades below key short-term indicators, reinforcing bearish control. Besides, the inability to reclaim resistance suggests that buyers are losing grip in the current range.

Broader market limits upside
Solana’s price action continues to track wider market sentiment, with Bitcoin trading below critical resistance levels. This environment has limited upside across major altcoins. Hence, risk appetite remains subdued, which continues to weigh on high-beta assets like Solana.
Network data shows a decline in decentralized exchange volumes compared to earlier peaks. This slowdown points to reduced user activity and weaker demand for the token. Moreover, lower transaction flow reduces the fundamental support that typically drives price strength.
Institutional demand has also cooled, with spot Solana ETF inflows showing signs of stagnation. This shift reflects cautious positioning among larger investors. Consequently, the absence of strong inflows removes a key pillar that previously supported price expansion.
Large transfers raise supply concerns
Recent blockchain data revealed a transfer of over 300,000 SOL to exchanges, increasing fears of potential selling pressure. Such movements often signal preparation for liquidation. Additionally, this development adds to existing concerns about rising supply in the market.
If the $80 support fails, the next downside targets appear near $75, followed by the $70 zone. These levels align with previous demand areas. However, a recovery above $88 could stabilize price action and weaken the current bearish structure.
