


Solana (SOL) Price Flashes “Buy” Signal, But the Setup Could Trap Buyers
ONDO
SOL
 SHOW
SHOW
 XMM
XMM
 MMT
MMT
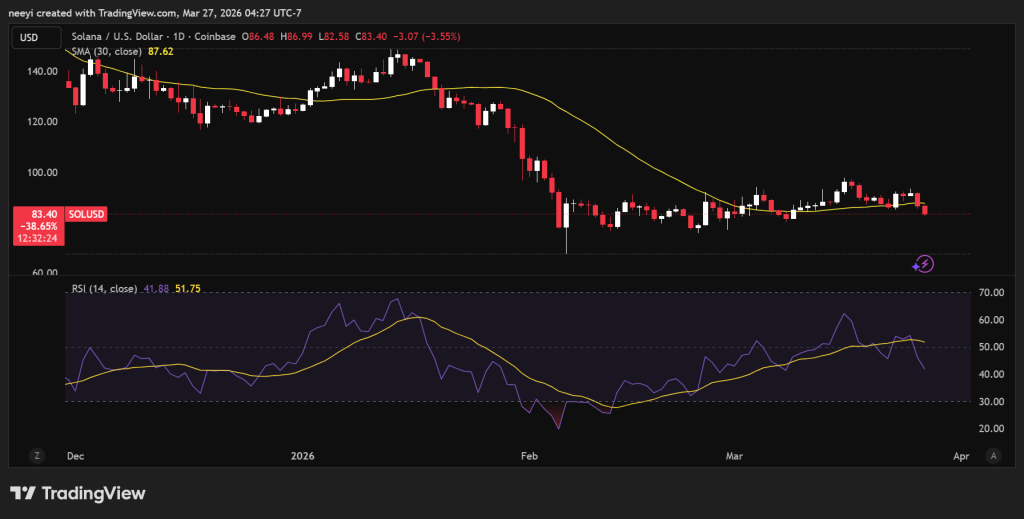
Solana price action has slipped into a quiet but tense zone near $83, and a fresh signal from a popular indicator has started to draw attention. The latest chart shared by Ali Charts points to a possible rebound, yet the broader structure tells a more cautious story.
Ali Charts highlighted that the TD Sequential has printed a buy signal on SOL. That signal usually appears after a series of consecutive bearish candles and often marks a point where selling pressure begins to fade.
A look at the SOL chart shows a steady decline from above $92 down toward the mid $80 range, followed by smaller candles and reduced downward momentum. That pattern fits the condition where the TD Sequential tends to trigger.
The chart shows multiple strong bearish candles earlier in the sequence. Price moved sharply lower before slowing near $85.96, where recent candles have turned smaller and less aggressive. That pause explains why the indicator flashed a buy setup. The logic is simple. Exhaustion in selling can open the door for a short-term bounce.
That reaction reveals something important. A buy signal does not automatically mean a trend reversal. It often points to a temporary relief move inside a broader downtrend.
TD Sequential flashes a buy signal on Solana $SOL, suggesting a rebound. pic.twitter.com/NVwoeMgEXu
— Ali Charts (@alicharts) March 27, 2026
Solana Price Trend Remains Bearish Across Higher Timeframes
Solana still trades under key moving averages, and that keeps the bigger picture under pressure. Current price sits around $83. The 7-day simple moving average stands near $88, and the 30-day average is close to $87. Price remains below both levels, which shows that short-term and medium term trends still lean bearish.
The longer-term view looks even weaker. The 200-day simple moving average sits around $143.25, far above the current price. That gap confirms that the broader trend has not recovered from previous declines.
Recent performance adds more context. SOL has stayed mostly flat over the last 30 days with a modest gain of about 0.78%. At the same time, price remains about 71.72% below its all-time high. That distance highlights how far the asset still needs to climb before any full recovery discussion becomes realistic.
This setup points to a market that is under pressure but attempting to stabilize. A base may be forming, yet there is no clear sign of a strong uptrend taking control.
Momentum Indicators Show Early Signs Of Recovery Without Strong Confirmation
Momentum indicators offer a mixed picture that supports caution. The daily MACD shows a small positive edge. The MACD line sits around 0.26, slightly above the signal line near 0.21. A small positive histogram suggests that bearish pressure has eased, though the move lacks strength.
RSI values tell a similar story. The 7-day RSI sits around 33, and the 14-day RSI is close to 41. These levels indicate weak momentum. The shorter RSI near 30 suggests that SOL is close to oversold territory. That condition can allow a bounce if buyers step in.
Price still trades below the pivot level near $87.95. That detail keeps the short-term bias tilted downward unless SOL reclaims that level.
Taken together, these indicators show that selling pressure has cooled. Buyers have not fully taken control yet.
Key Solana Price Levels Define The Next Move
Solana now sits at a point where both scenarios remain open. Holding above the $81 to $77 support zone keeps the recovery idea alive. A push above $91 would show that buyers are gaining strength. A stronger confirmation would come from a daily close above $97, followed by stability above $100.
Failure to defend support would change the outlook quickly. A breakdown below $77 would invalidate the current base structure and extend the bearish trend.
The TD Sequential signal shared by Ali Charts highlights a possible short-term bounce. The broader trend still leans bearish, and that creates a gap between what the indicator shows and what the market structure confirms.
Solana has reached a moment where patience matters. Price is no longer falling aggressively, yet it has not proven that a real recovery has begun. The next few sessions will reveal whether this buy signal leads to a meaningful move or fades inside the wider downtrend.
Subscribe to our YouTube channel for daily crypto updates, market insights, and expert analysis.
The post Solana (SOL) Price Flashes “Buy” Signal, But the Setup Could Trap Buyers appeared first on CaptainAltcoin.
