


UnitedHealth Group (UNH) Surges After Q1 2026 Earnings Beat — $564 Target in Play?
 UNHX
UNHX
 WUNHX
WUNHX
Key Highlights
- UnitedHealth Group (NYSE: UNH) is trading at approximately $384 — up +2.12% in 24 hours and +23.76% over 30 days — staging a powerful recovery from its 2025 lows near $234–$255.
- Q1 2026 earnings delivered a significant beat — Adjusted EPS of $7.23 vs consensus of $6.59, and revenue of $111.7 billion vs estimates of $109.4 billion — with full-year 2026 guidance raised to >$18.25 adjusted EPS.
- The weekly chart is forming a Bearish Bat harmonic pattern — with price recovering from the Point C low near $255.97 and now approaching the key 100-week MA at $420.87 as the next major hurdle.
- A sustained break above the 100-week MA at $420.87 would open the path toward the harmonic pattern's PRZ target at $563.98 — the pattern's measured completion zone.
UnitedHealth Group has staged one of the more impressive recoveries in the large-cap healthcare space in 2026. After enduring a sustained multi-month decline that took UNH from highs above $600 all the way down to lows near $234–$255 in 2025, the stock has reclaimed key technical levels and is now building genuine bullish momentum — driven by a combination of strong fundamental results and a compelling weekly chart setup that technical traders are watching closely.
As of May 9, 2026, UNH is trading at approximately $384 — with a +23.76% gain over the past 30 days confirming that the recovery has moved well beyond a simple dead-cat bounce into something more structurally significant.
 UNH Stock Price on 09 May 2026/Source: Coinmarketcap
What Drove the Recovery — Q1 2026 Earnings Beat
The decisive catalyst for UNH’s current rally was the company’s Q1 2026 earnings report released on April 21, 2026 — which delivered results that significantly exceeded analyst expectations across every major metric and put to rest the margin concerns that had weighed on the stock throughout 2025.
The key numbers:
MetricActualEstimatevs EstimateAdjusted EPS$7.23~$6.59+9.7% beatRevenue$111.7B~$109.4B+2.1% beatMedical Care Ratio83.9%~85.5%Better by 160bpsFull-Year EPS Guidance>$18.25Prior >$17.75Raised
The Medical Care Ratio (MCR) improvement deserves particular attention. The MCR measures what percentage of premium revenue is paid out in medical claims — a lower number is better for the insurer’s profitability. The improvement from an expected 85.5% to an actual 83.9% signals that UNH has successfully addressed the cost pressures and unprofitable contract exposures that had damaged margins throughout 2025 — through a combination of disciplined repricing and strategic exits from loss-making business lines.
Beyond the headline numbers, several additional positives reinforced the bullish case:
- $8.9 billion in operating cash flow — demonstrating the underlying business continues to generate strong cash regardless of reported earnings fluctuations
- $2 billion share buyback announced — to be completed by end of Q2 2026 — directly supporting per-share value
- JPMorgan raised its price target to $420 — among a wave of analyst upgrades following the earnings beat
- Favourable final 2027 Medicare Advantage rate increase from CMS — providing additional visibility into next year’s revenue outlook
The combination of these factors confirmed that UNH has turned the corner on 2025’s margin pressures — reigniting institutional confidence and providing the fundamental foundation for the technical recovery that followed.
UNH Analysis Hints at Potential Upside
On the weekly chart, UNH appears to be forming a Bearish Bat harmonic pattern — a structure that often allows for a bullish advance during the CD leg before reaching the Potential Reversal Zone (PRZ).
The pattern originated near Point X around $606.36, followed by a sharp decline into Point A. From there, UNH rebounded into Point B before pulling back once more into Point C near the $255.97 region. This area acted as a strong demand zone, where buyers stepped in aggressively to prevent further downside.
Since establishing the Point C low, UNH has staged a steady recovery and is now trading near $380. Importantly, price has reclaimed the 50-week moving average around $314.88 — a key short-term support now.
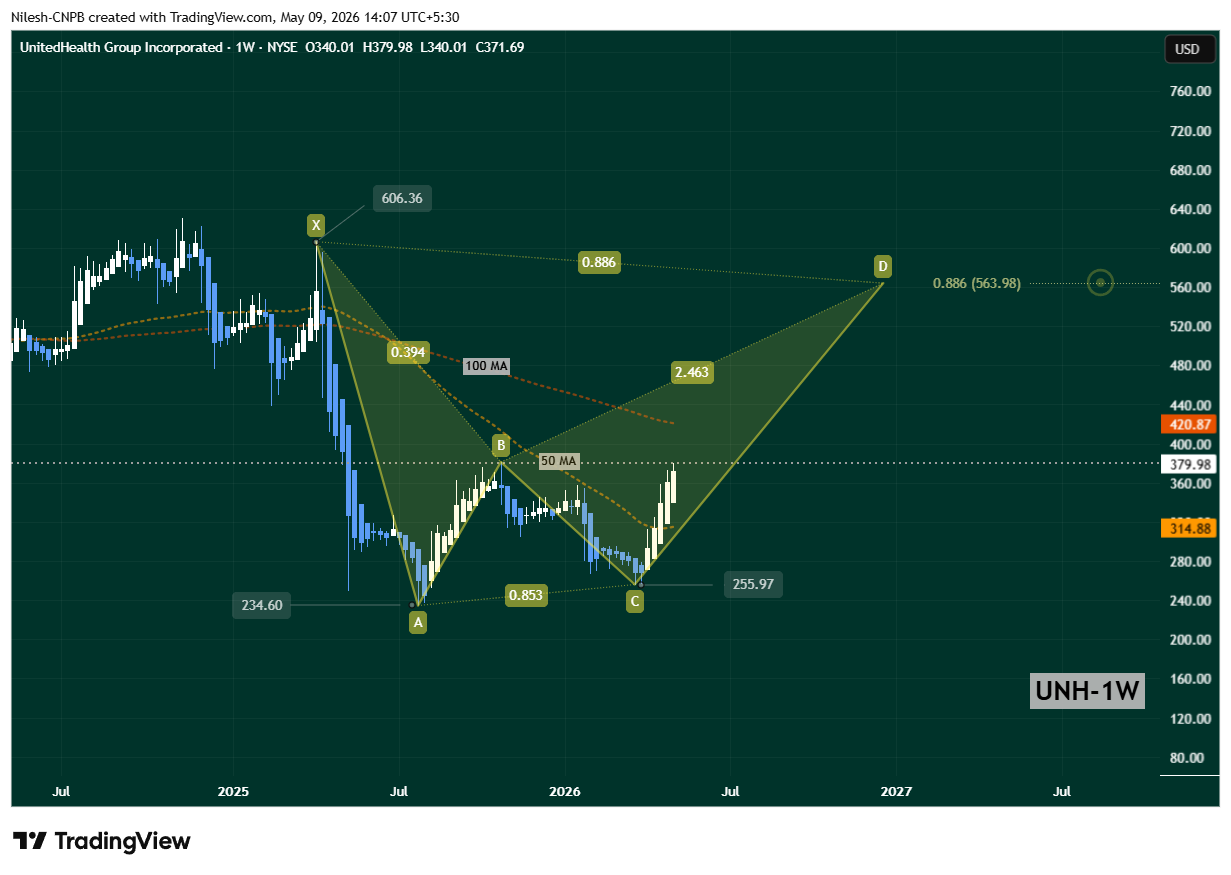 Chart: UNH Weekly | Source: TradingView
The next major technical hurdle sits at the 100-week moving average near $420.87. A clean break and sustained hold above this level would confirm the continuation of the CD leg and significantly strengthen the bullish case.
What’s Next for UNH — Two Scenarios
Bullish Scenario
If UNH continues to defend the 50-week MA at $314.88 as support and manages to break and hold above the 100-week MA at $420.87 on a sustained weekly closing basis, the harmonic structure points toward a move into the PRZ (Potential Reversal Zone) at $563.98 — the 0.886 Fibonacci extension level that marks the Bearish Bat pattern’s completion.
This $563.98 target aligns with prior resistance from earlier in UNH’s chart history — making it a technically logical zone where the stock could encounter meaningful selling pressure or consolidate after the extended recovery move. Getting from the current $384 to the $563.98 PRZ would represent a further +46.9% move from current levels.
Bearish Scenario
If UNH fails to hold above the 50-week MA at $314.88 — whether through broader market weakness or a deterioration in the fundamental outlook — the immediate risk is a consolidation phase or shallow pullback. However the broader recovery structure would remain intact as long as the $255.97 Point C support zone holds on a weekly closing basis.
A sustained break below $255.97 would invalidate the harmonic pattern entirely and signal that the 2025–2026 recovery has failed — requiring a full reassessment of the technical outlook.
Bottom Line
UnitedHealth Group is presenting one of the more compelling setups in the large-cap healthcare space in 2026. The Q1 earnings beat — with a near-10% EPS outperformance, meaningful MCR improvement, and a raised full-year guidance — has provided the fundamental foundation that the technical recovery needed. The Bearish Bat harmonic pattern developing on the weekly chart gives traders a defined structure with clear levels to monitor.
The immediate focus is $420.87 — the 100-week MA and the level that separates the current recovery from a confirmed continuation toward the $563.98 harmonic target. As long as UNH defends $314.88 as support and continues to print higher lows, the technical and fundamental cases remain aligned.
Frequently Asked Questions (FAQ)
Why is UnitedHealth Group (UNH) surging in 2026?
UNH staged a powerful recovery after its Q1 2026 earnings report on April 21 delivered a significant beat — Adjusted EPS of $7.23 vs $6.59 consensus, revenue of $111.7B vs $109.4B estimates, an improved Medical Care Ratio of 83.9%, and a raised full-year guidance to >$18.25 adjusted EPS.
What is the Medical Care Ratio and why does it matter?
The Medical Care Ratio (MCR) measures what percentage of premium revenue is paid out in medical claims — a lower number means better profitability. UNH’s MCR improved to 83.9% vs the expected 85.5% — signalling successful cost discipline and repricing that directly addresses the margin pressures that weighed on the stock throughout 2025.
What is the Bearish Bat harmonic pattern on UNH’s weekly chart?
The Bearish Bat is a harmonic pattern using specific Fibonacci ratios — despite its name it often allows a significant bullish advance during the CD leg before reaching the Potential Reversal Zone. On UNH’s chart the pattern originated at Point X ($606.36) and has established Point C at $255.97 — with the current recovery representing the CD leg moving toward the PRZ at $563.98.
Disclaimer: The views and analysis presented in this article are for informational purposes only and reflect the author’s perspective, not financial advice. Technical patterns and indicators discussed are subject to market volatility and may or may not yield the anticipated results. Investors are advised to exercise caution, conduct independent research, and make decisions aligned with their individual risk tolerance.
Also Read: Pump.fun Traders Are Finally Making Money — Profitability Hits ATH After Two Years
